2D Interferometry, PSFs, Gridding, and Dirty Images
References for today
- Interferometry and Synthesis in Radio Astronomy by Thompson, Moran, and Swenson, particularly Appendix 2.1
- Essential Radio Astronomy by James Condon and Scott Ransom
- The Fourier Transform and its Applications by R. Bracewell
Review of last time
- We talked about R.A., Dec., and direction cosines as coordinates on the sky
- We introduced a two-element interferometer with multiply and add correlator backend
- We introduced the fringe pattern \(F(l)\) of a two-antenna interferometer, which is a cosine wave on the sky
- We discussed how the frequency of this fringe pattern (i.e., the spatial frequency) changes as a function of baseline length between the two antennas
- We introduced the visibility function \(\mathcal{V}(u)\) as the Fourier transform of the sky-brightness \(I(l)\)
- And discussed how the output from the interferometer changes in response to a point source and an extended source
This time
- Extend our discussion to a general interferometer with north-south and east-west baselines
- Discuss arrays with multiple antennas
- Earth aperture synthesis
- \(u,v\) sampling distributions for various arrays
- point spread functions (PSFs) and their relationship to the sampling distribution
Wrapping up 1D
Last time, we had said the response \(R(l)\) of the interferometer to some sky distribution \(I(l)\) is to act as a convolution $$ R(l) = \cos(2 \pi u l) * I(l). $$ In this case, you can think of the fringe function as a point spread function (a terrible one), that is convolving out the true sky brightness distribution.
Another way to look at this, though, is through our old friend the multiplication/convolution algorithm. Let \(u_0\) be the (fixed, instantaneous) baseline distance between two antennas, measured in multiples of the observing wavelength $$ u = \frac{D \cos \theta}{\lambda} $$ where \(\theta\) is the angle from zenith.
Then, the Fourier pair of the fringe function is $$ \cos(2 \pi u_0 l) \leftrightharpoons \frac{1}{2} [\delta(u + u_0) + \delta(u - u_0)]. $$ These are two delta functions situated at \(\pm u_0\).
The Fourier pair of the sky brightness distribution is called the visibility function $$ I(l) \leftrightharpoons \mathcal{V}(u). $$
In the Fourier plane, the response of the interferometer is a multiplication $$ \cos(2 \pi u l) * I(l) \leftrightharpoons \frac{1}{2} [\delta(u + u_0) + \delta(u - u_0)] \times \mathcal{V}(u) $$ i.e., the interferometer has sampled the visibility function at locations \(\pm u_0\) corresponding to the baseline distance of the two antennas.
Another way to think about this is that the interferometer acts as a spatial filter that only responds to the two spatial frequencies \(\pm u_0\). \(\mathcal{V}(u)\) represents the amplitude and phase of the sinusoidal component of the intensity distribution with spatial frequency \(u\) cycles per radian. The negative spatial frequency doesn’t have a physical meaning but is a mathematical convenience. Because the intensity distribution on the sky is a real quantity, the visibility function itself is symmetric about the origin in a Hermitian sense, meaning it has real even parts and odd imaginary parts.
Moving on to the general case
- We’re going to take our two-element interferometer and re-derive the same relationships using a general vector formalism
- Then, we’re going to introduce a general 3D cartesian coordinate set to the problem, which is used by most interferometers
Coordinates
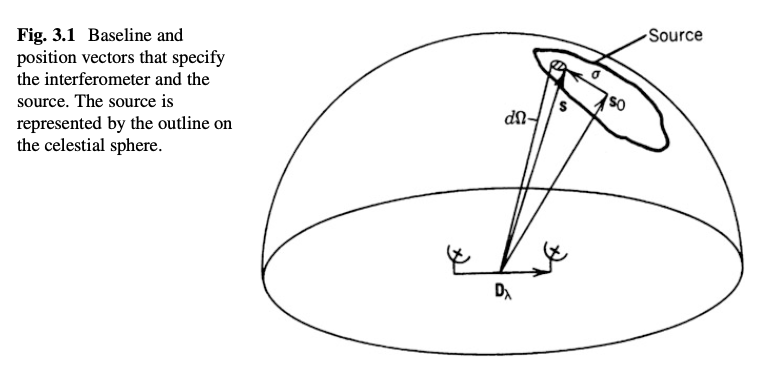
Let’s consider a generic situation of a two-element interferometer observing (tracking) a source on the sky with phase center \(\mathbf{s}_0\).

TMS Fig 3.1
Antenna power pattern: An element of the source with solid angle \(d\Omega\) at some position \(\mathbf{s} = \mathbf{s}_0 + \mathbf{\sigma}\) will contribute an element of power \( \frac{1}{2} A(\sigma) I(\sigma) \Delta \nu d\Omega\), where \(A\) is some (normalized) power pattern of a single antenna. For now, you can consider it to be a directionally smooth function that is effectively constant over the field of view of interest.
From what we just talked about for the 1D example, the component of the correlator output will be equal to the received power and to the fringe term \(\cos(2 \pi \nu \tau_g)\).
Let \(\mathbf{D}_\lambda\) be a baseline vector which points from the central antenna to the other one, and specifies the baseline length in multiples of the observing wavelength. Then
$$ \nu \tau_g = \mathbf{D}_\lambda \cdot \mathbf{s} = \mathbf{D} \cdot (\mathbf{s}_0 + \mathbf{\sigma}). $$
To calculate the output from the correlator, we need to integrate over the spatial distribution of the source
$$ r(D_\lambda, s_0) = \Delta \nu \int_{4 \pi} A(\mathbf{\sigma}) I(\sigma) \cos [2 \pi D_\lambda \cdot (s_0 + \mathbf{\sigma})]\,\mathrm{d}\Omega $$
Here we see an opportunity to use our sine/cosine difference angle formulae again to split this up into sine and cosine components and then use Euler’s formula to put it back together.
Let’s define the complex visibility as $$ \mathcal{V} = \int_{4 \pi} A_N(\sigma) I(\sigma) e^{-i 2 \pi D_\lambda \cdot \sigma}\,\mathrm{d}\Omega $$ which I hope you agree looks suspiciously like a Fourier transform.
When an interferometer observes a source, it is sampling the visibility function at these points (corresponding to a spatial frequency of \(\pm \mathbf{D}_\lambda \cdot \mathbf{s}_0 \)). You can think of this measurement as just recording the real and imaginary values of the visibility function, or alternatively, some visibility amplitude and some visibility phase $$ \mathcal{V} = |\mathcal{V}|e^{i \phi}. $$
3D coordinates
Now that we’ve introduced how the visibility function comes about in a general vector formalism, let’s get concrete with respect to coordinates on Earth and in the sky.

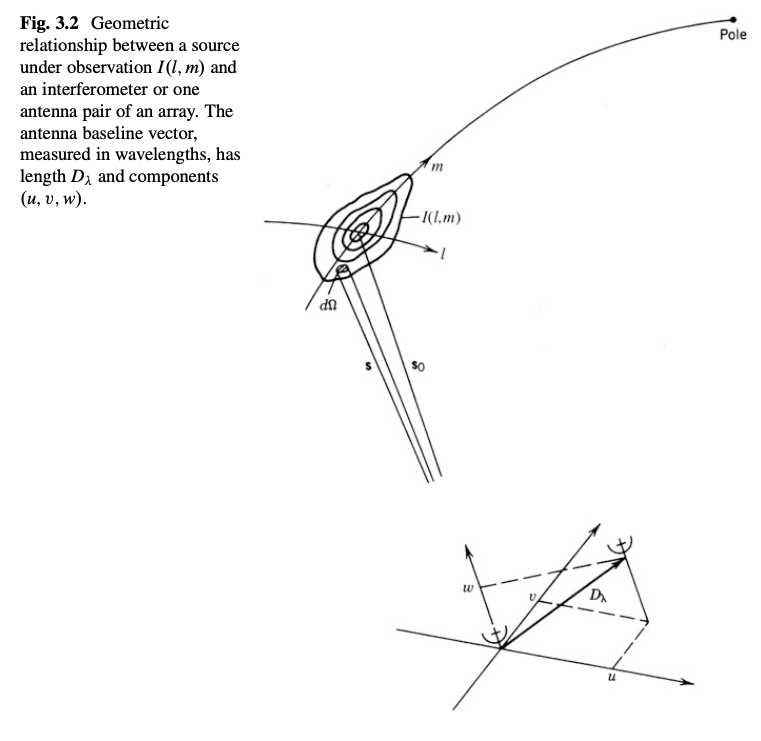
Credit: TMS Fig 3.2. Note that the \(l\) and \(m\) coordinates technically index the flat image plane tangent to \(\mathbf{s_0}\), not curved as they are shown here.
Let’s focus in on the \(u,v, w\) coordinate system in the bottom of the figure. The plane is centered at the location of one of the antennas \(u=0,v=0, w=0\). We can also draw our baseline vector \(\mathbf{D}_\lambda\) in this coordinate system, pointing to the other antenna. The \(w\) unit vector is pointing towards phase center \(\mathbf{s}_0\) (i.e., the direction of the source).
Another way of saying this is $$ \mathbf{D}_\lambda \cdot \mathbf{s}_0 = w. $$ So, you can think of the \(u,v\) plane \(w = 0\) as oriented orthogonal to the vector pointing towards phase center. But, N.B. that the baseline vector itself does not necessarily live in the \(w = 0\) plane, it can have a non-zero \(w\) component.
Using this coordinate system, let’s focus on rewriting the \(\mathbf{D}_\lambda \cdot \mathbf{s}\) term. Recall that the dot product between two vectors is
$$ \mathbf{a} \cdot \mathbf{b} = ||a|| \; ||b|| \cos \theta. $$ Therefore we have $$ \mathbf{D}_\lambda \cdot \mathbf{s} = \left ( ul + vm + wn \right). $$ Wow, that was simple. Hopefully now you see why it was convenient to use \(l, m\) as direction cosines!
\(n\) is the third direction cosine and is w.r.t. the \(w\) axis. It is not independent of \(l, m\) and can be written in terms of them as $$ n = \sqrt{1 - l^2 - m^2}. $$
So we would normally write $$ \mathbf{D}_\lambda \cdot \mathbf{s} = \left ( ul + vm + w\sqrt{1 - l^2 - m^2} \right). $$
This factor also appears in the solid angle differential. As we move from phase center, the solid angle is changed by a factor $$ d \Omega = \frac{\mathrm{d}l\; \mathrm{d} m}{\sqrt{1 - l^2 - m^2}}. $$ This is adjusting for the fact that the solid angle is something on the celestial sphere, but we are measuring it using the direction cosines on the tangent plane.
With these relationships in hand, we can rewrite the visibility function as $$ \mathcal{V}(u, v, w) = \int_{-\infty}^\infty \int_{-\infty}^\infty A_N(l,m) I(l,m) \exp \left \{ -i 2 \pi \left [ ul + vm + w \left ( \sqrt{1 - l^2 - m^2} - 1 \right )\right ] \right \} \;\frac{\mathrm{d}l\;\mathrm{d}m}{\sqrt{1 - l^2 - m^2}}. $$
The factor in the exponential comes about from the measurement of angular position with respect to phase center (\(\mathbf{D}_\lambda \cdot \mathbf{s})\), as we saw in the “general coordinates” example.
If all of the measurements could be made with the antennas in a plane normal to the \(w\) direction such that \(w=0\), then we would turn this equation into an exact 2D transform. But this isn’t usually the case and we need to make approximations.
So long as we are in the small-field regime and \(l\) and \(m\) are small enough such that the term $$ \left ( \sqrt{1 - l^2 - m^2} - 1 \right ) w $$ can be neglected (\(\simeq - \frac{1}{2}(l^2 + m^2)w\) in this regime), then we have $$ \mathcal{V}(u, v, w) \simeq \mathcal{V}(u, v, 0) = \int_{-\infty}^\infty \int_{-\infty}^\infty \frac{A_N(l,m) I(l,m)}{\sqrt{1 - l^2 - m^2}} \exp \left \{ -i 2 \pi \left [ ul + vm \right ] \right \} \;\mathrm{d}l\;\mathrm{d}m. $$
OK! So we’ve arrived at the result that I told you about at the beginning of last week’s class, that the visibility function is the Fourier transform of the sky brightness (modified by the primary beam of each antenna, which we can mostly ignore for this discussion as a constant). The approximation we made for the \(w\) term places a limit on the maximum size of the field that we can image (at once). There are approaches designed to overcome this scenario, but at least in the context of this course we will restrict our discussion to those that don’t require it. This is generally the case for all images made with VLA or ALMA for a single pointing (i.e., imaging the full primary beam). If you use multiple pointings of the array (generally called “mosaicing”) to make an even larger image, you’ll need to take into account the effects of the \(w\) term.
Revisiting “slightly extended source: A “slightly extended source” is something that is larger than the dirty beam but smaller than the primary beam of each telescope. Instantaneous field of view of an interferometer is the same as the primary beam of each telescope, treated as a single dish (see previous section). Each single dish antenna is still seeing the same thing as before, it’s just that we have a correlator backend that’s doing things with the signals, allowing us to create a synthesized beam that is considerably smaller than the size of the primary beam. For example, at 220 GHz (band 6), ALMA has a primary beam of about 20 arcseconds in diameter. However, it’s common to make synthesized beams on the size of 0.1 arcseconds or smaller.
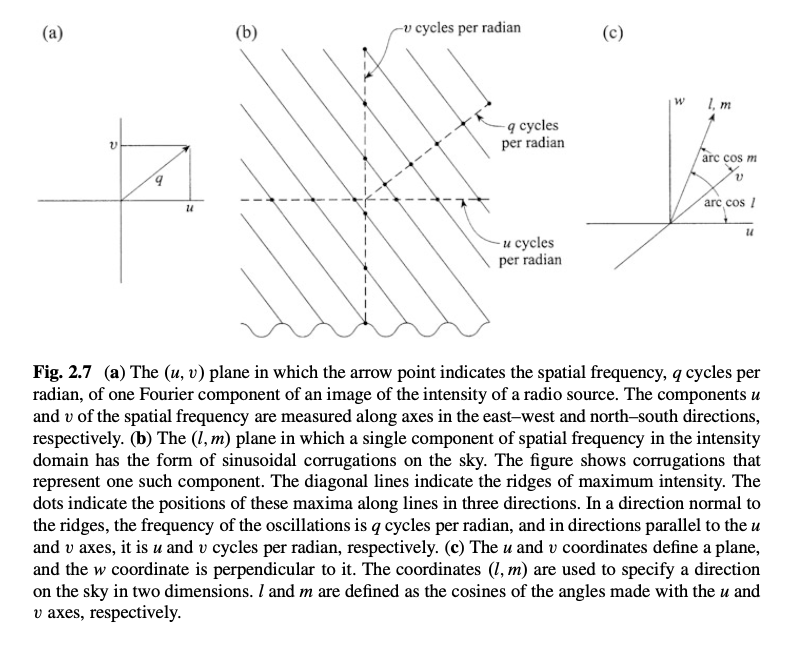
Let’s also briefly discuss what the \(u,v\) coordinate plane looks like, now that we are in 2D:

Credit: TMS Fig 2.7
Units of \(\mathcal{V}\)
What are the units of \(\mathcal{V}\) itself? We can get at this by looking at the units of \(I_\nu(l,m)\) and how we carried out the Fourier transform integral (in its simplified form).
$$ \mathcal{V}(u, v) = \int_{-\infty}^\infty \int_{-\infty}^\infty I(l,m) \exp \left \{ -i 2 \pi \left [ ul + vm \right ] \right \} \;\mathrm{d}l\;\mathrm{d}m. $$
If we parameterized our image using \(\mathrm{Jy} / \mathrm{arcsec}^2\) and we integrated over \( \mathrm{d}l\, \mathrm{d}m\) (both assuming they had units of arcsec), then \(\mathcal{V}\) must have units of Jy. I.e., you can think of it sort of like the flux being observed at that angular scale. The visibility function is complex-valued, so if you want to discuss the “power” of an image at some angular scale then you should consider \(|\mathcal{V}|^2\).