Absorption Lines and Curve of Growth
- Ryden and Pogge Ch. 2.3: Building Absorption Lines
- Ryden and Pogge Ch. 2.4: Curve of Growth
- Draine Ch. 9: Absorption Lines: The Curve of Growth
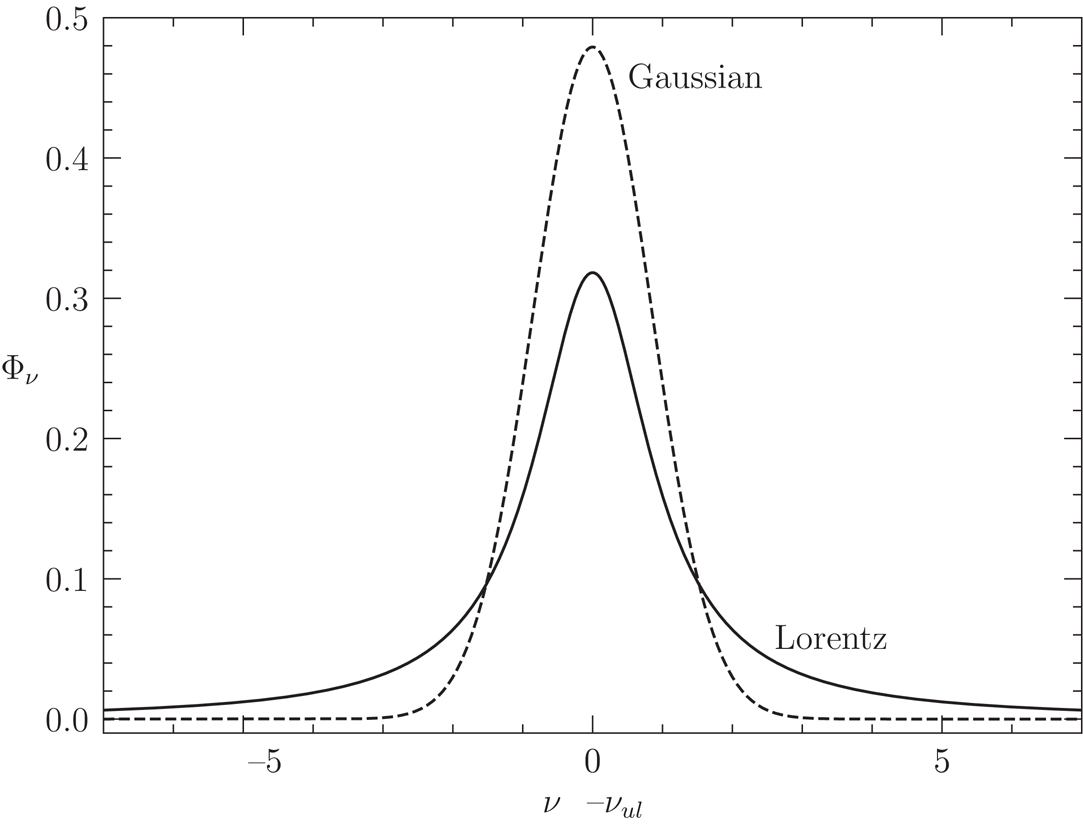
Lorentzian and Gaussian line profiles. Credit: Fig 2.4 Ryden and Pogge
So far we’ve talked about the
- intrinsic line profile, whose width comes about from quantum mechanical uncertainty, and takes on a Lorentzian form
- Gaussian line profile, which comes about from thermal motions
In truth, we have a convolution of these two profiles, called a Voigt profile.
$$ \phi_\nu^\mathrm{Voigt} = \frac{1}{\sqrt{\pi}}\frac{1}{\nu_{ul}}\frac{c}{b}H(a,u) $$ where \(H(a,u)\) is a dimensionless function describing the shape of the Voigt profile. It was first tabulated by Frode Hjerting in 1938, and is why we call this combined thing the Voigt-Hjerting function. You can use a special functions library to calculate this profile exactly; for our purposes, we are mainly concerned with observing the astrophysical behaviors that manifest from the fact that this profile has both a Gaussian core and Lorentzian wings. You can think of the \(a\) parameter (what R&P term the ratio of intrinsic broadening to thermal broadening) as a tuning between its “Gaussian-ness” (low \(a\)) and its “Lorentzian-ness” (high \(a\)).
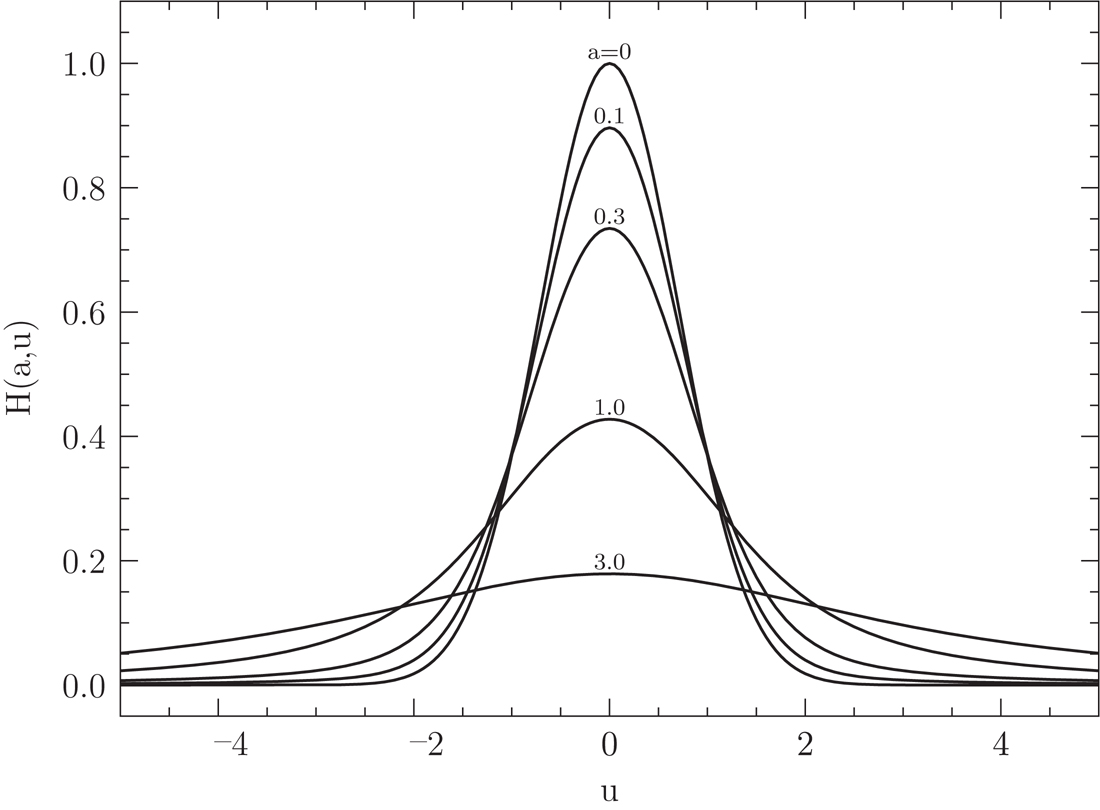
The Voight-Hjerting function \(H(a,u)\) with various intrinsic-to-broadening ratios \(a\). Credit: Fig 2.5 Ryden and Pogge
Building absorption lines
Let’s assume that we have a known background source illuminating some neutral hydrogen cloud with known
- number density \(n_l\)
- temperature
- Einstein coefficients for the transition
- assume the cloud is cold enough so that we can ignore spontaneous emission and \(j_\nu \approx 0 \)
- \(\phi_\nu\) is constant everywhere
What does the absorption line look like?
This is just another way of asking what is the emergent \(I_\nu\), where in this case we are additionally interested in the \(\nu\) dependence.
So let’s write down the RTE and get cracking. $$ I_\nu(\tau_\nu) = I_\nu(0)e^{-\tau_\nu} + \int_0^{\tau_\nu} e^{-(\tau_\nu - \tau^\prime)}S_\nu d \tau^\prime $$ Since $$ S_\nu = \frac{j_\nu}{\kappa_\nu} \approx 0 $$ we have $$ I_\nu(\tau_\nu) = I_\nu(0)e^{-\tau_\nu} $$ For this problem, we basically have some initial (known) intensity that is attenuated by the intervening absorbers. The thing we want to calculate is the optical depth \(\tau_\nu\), which we do by $$ \tau_\nu = \int \kappa_\nu d s = \int n_l \sigma_{lu}(\nu) ds $$ $$ \tau_\nu = \frac{g_u}{g_l}\frac{c^2}{8 \pi \nu^2_{ul}}A_{ul} \int n_l \phi_\nu ds $$ and from our assumptions we have \(\phi_\nu\) constant along line of sight so we can take $$ \int n_l ds = N_l $$ to a column density, and result in $$ \tau_\nu = \frac{g_u}{g_l}\frac{c^2}{8 \pi \nu^2_{ul}}A_{ul} N_l \phi_\nu. $$ Remember that \(\phi_\nu\) is our Voigt profile.
We can plug this back in and solve for the emergent intensity we were after $$ I_\nu(\tau_\nu) = I_\nu(0)e^{-\tau_\nu}. $$
When \(\tau_\nu < 1\), we can use the small exponent approximation to show that $$ \frac{I_\nu(0) - I_\nu(\tau_\nu)}{I_\nu(0)} \approx \tau_\nu $$ meaning that the absorption line profile \(I_\nu\) follows the optical depth \(\tau_\nu\) as a function of frequency.
When \(\tau_\nu \gg 1\), though, we get \(I_\nu(0)e^{-\tau_\nu} \approx 0\). Cold, dense, optically thick things (that are not emitting themselves) block light!
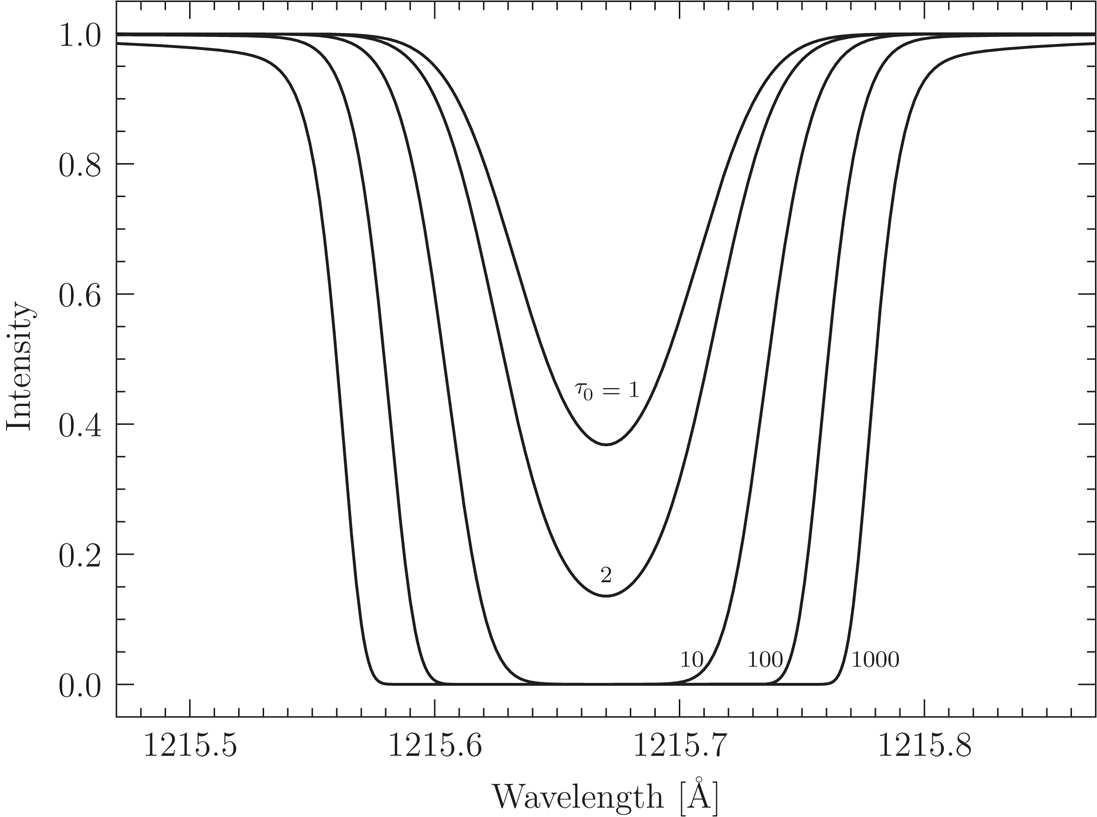
Lyman \(\alpha\) absorption lines with central optical depths of \(\tau\) from 1 through 1,000. Figure 2.6 from Ryden and Pogge.
What’s the relationship between \(I_\nu\) and \(F_\nu\) here? We’re just considering a single small patch with differential solid angle \(\Delta \Omega\), assuming that the properties of the source are uniform over that area, so then the integral is over a constant area and we have $$ I_\nu \propto F_\nu. $$ So in this discussion about absorption lines and curve and growth, you may see \(F_\nu\) and \(I_\nu\) used interchangeably.
Equivalent width
Equivalent width is a convenient and quick but imperfect way to boil down a rich measurement of \(I_\nu\) into a single number for tabulation.
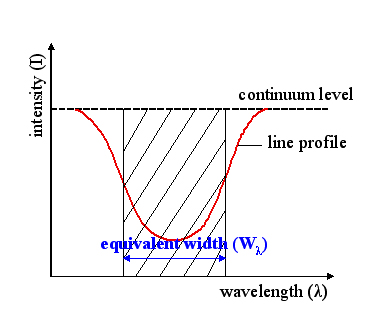
The equivalent width corresponding to the absorption line. Credit: Wikipedia/Szdori
How to calculate equivalent width?
- Take high resolution spectrum of a source
- Estimate the baseline “continuum” level from spectral regions that do not show absorption lines. Call this \(F_\nu(0)\)
- Integrate over (sum up) the absorption line region \(F_\nu\)
- Compare how much of the continuum region you’d need (absorbed at 100%) to match the integrated absorption in the actual line
The equivalent width is \(W\), and, confusingly, there are many different definitions out there in the wild.
If you’re working at optical wavelengths, I always found the “wavelength equivalent width” to be the easiest to comprehend, which is calculated using \(F_\lambda\) common to optical spectra $$ W_\lambda = \int \frac{\mathrm{continuum} - \mathrm{line}(\lambda)}{\mathrm{continuum}} d \lambda $$ and has units of wavelength. Phrased with mathematical symbols $$ W_\lambda = \int \frac{F_\lambda(0) - F_\lambda }{F_\lambda(0)} d \lambda. $$
There are other definitions! For example, R&P and Draine prefer a dimensionless equivalent width $$ W = \int \frac{d \nu}{\nu_0} \left [ 1 - \frac{F_\nu}{F_\nu(0)} \right] = \int \frac{d \nu}{\nu_0} ( 1 - e^{-\tau_\nu}). $$ We’ll use the dimensionless equivalent width for any problem sets and tests (it has no units). They are related via $$ W_\lambda \approx \lambda_0 W. $$ The problem with the wavelength width is that if you measure \(W_\lambda = 1\)Å, it corresponds to a very different set of physical conditions if you’re looking at a line with line center \(\lambda = 4000\)Å vs \(\lambda = 8000\)Å. This is because we would expect $$ \frac{\Delta \lambda}{\lambda} $$ to be approximately constant across the spectrum, and this is captured by the dimensionless equivalent width. There is also a velocity-equivalent width (\(W_v = c W\)). So, if you’re going to compare equivalent widths, make sure you understand the definition that is being used. Some authors define \(W > 0\) for emission lines, others for absorption lines.
Much of the historical literature focuses on equivalent width measurements, and comparing these.
My recommendation: If you are lucky to have a high resolution spectrum of an object, realize that you have a lot of information in how \(F_\nu\) varies with \(\nu\). Why go destroy some of it just to represent it as a single number? If you have a detailed physical model, you can fit \(F_\nu\) directly. Don’t bother thinking too hard about equivalent widths.
For example, lets look at some real absorption lines and see why we’d actually want to take a look at the spectra themselves rather than just reporting a single number, \(W\). UV interstellar absorption lines. Figure 2.2 Ryden and Pogge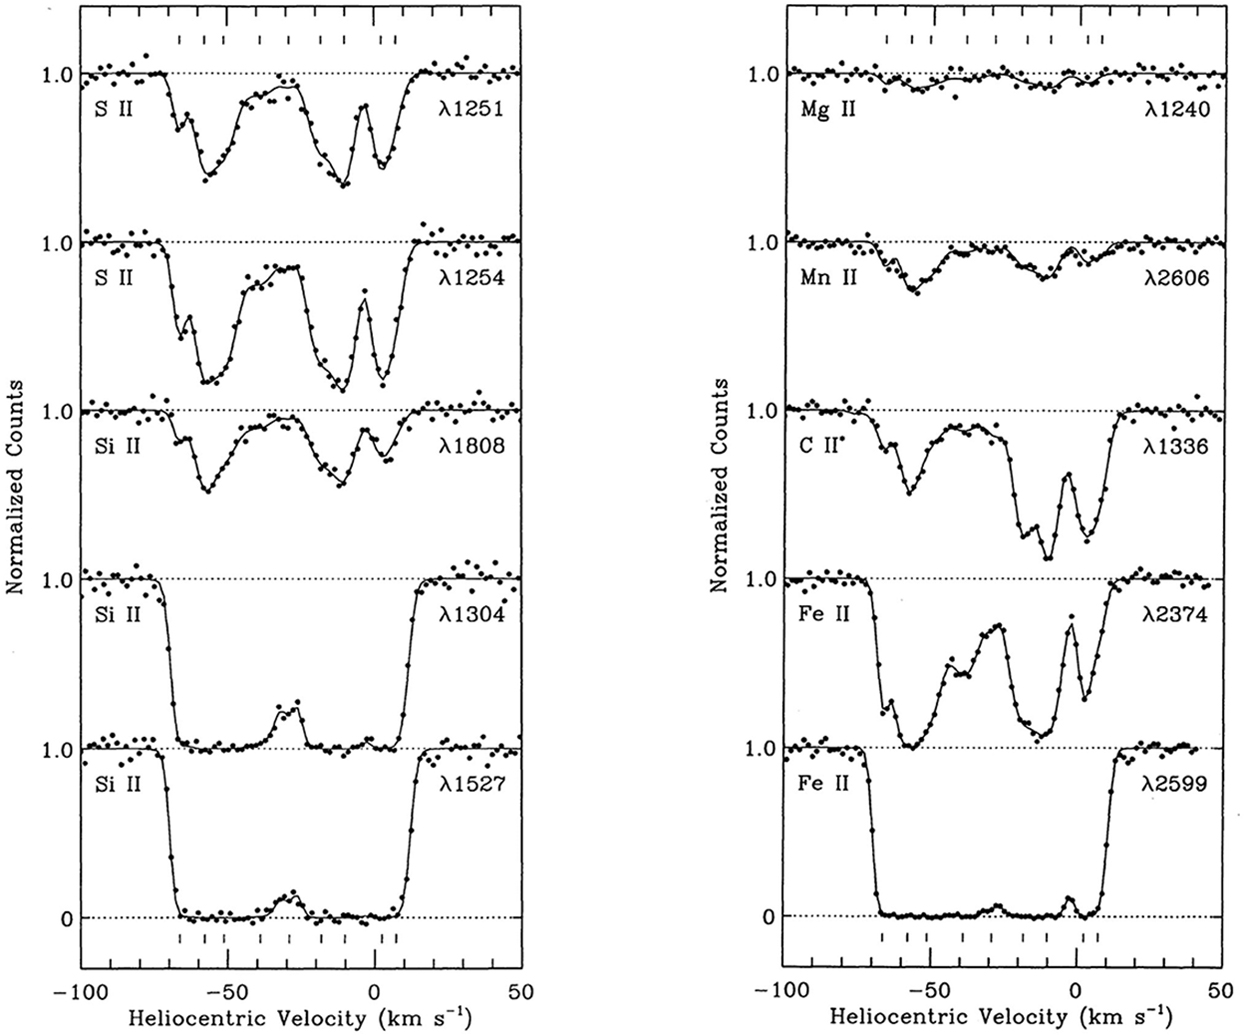
That said, it’s worthwhile thinking about how a line saturates with increasing optical depth, and the measure of equivalent width is useful for this exercise. Our goal is to
- Measure some line profile
- Make some assessment of the optical depth
- Use the line depth/shape and our understanding of radiative transfer to arrive at some conclusion about the column density of absorbers \(N_l\).
Curve of growth
Let’s examine how the line profile changes with increasing optical depth at line center, \(\tau_0\). Note: optical depth is not the same for all \(\lambda\), i.e., we have \(\tau_\lambda\) or \(\tau_\nu\)! That’s the point of the whole upcoming discussion!

Lyman \(\alpha\) absorption lines with central optical depths of \(\tau_0\) from 1 through 1,000. Figure 2.6 from Ryden and Pogge.
The curve of growth is a relationship between the observed equivalent width \(W\) and the optical depth at line center \(\tau_0\).
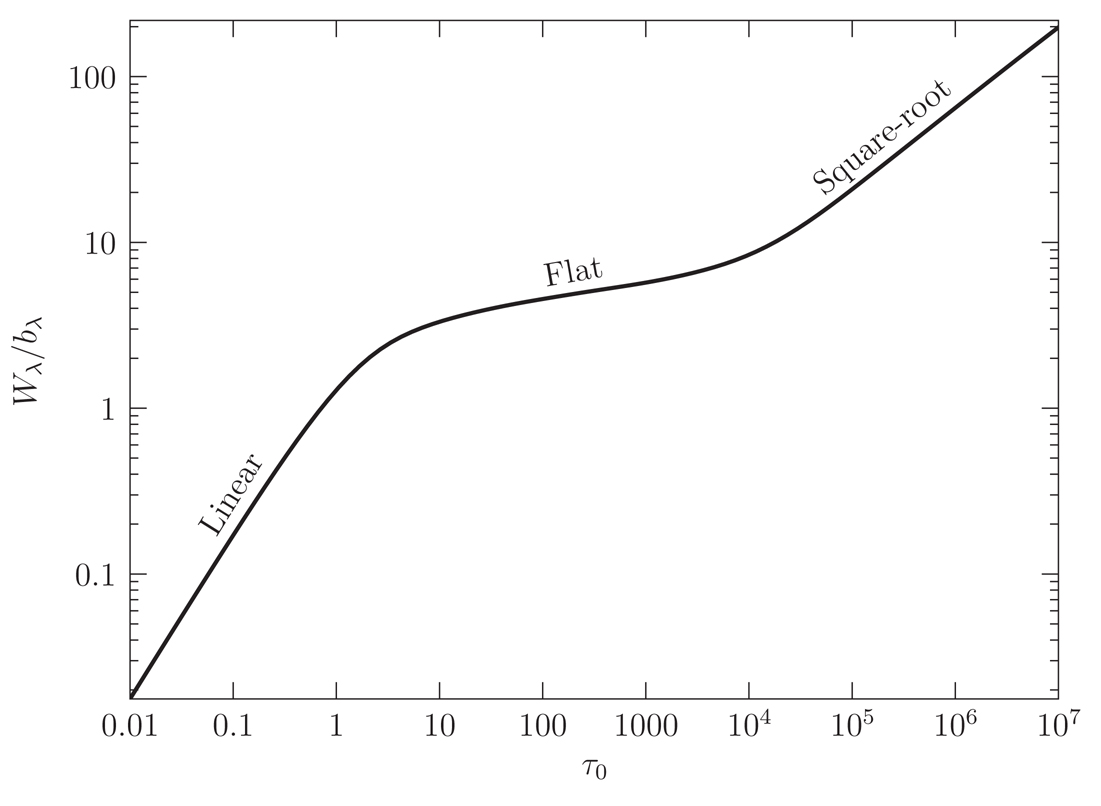
Curve of growth for the same Lyman \(\alpha\) line. Figure 2.7 from Ryden and Pogge.
Note that the curve of growth is a log-log plot! It is divided up into three regimes
Linear
- optically thin
- only the Gaussian core of a line contributes significant EW
- \(W\) is linear with \(\tau_0\) (and thus also with \(N_l\))
- \(N_l\) can be directly calculated from a measurement of \(W\)
- thermal broadening of the line cancels out in determination of \(N_l\) (good, we don’t need to know temperature!)
Damping Optical Depth
There is a transition whether the Lorentzian wings provide much contribution to the equivalent width calculation. This is called the damping optical depth \(\tau_\mathrm{damp}\), and depends on temperature as well as the properties of the absorber.
- For \(1 \leq \tau_0 \leq \tau_\mathrm{damp} \), this is the flat portion.
- For \(\tau_0 \geq \tau_\mathrm{damp}\), this is the “square-root” or damped portion
For the line in this plot, \(\tau_\mathrm{damp} \approx 10^{3.5}\).
Flat
- optically thick but not so much that the Lorentzian wings provide much contribution to equivalent width calculation (they remain shallow): \(0 \leq \tau_0 \leq \tau_\mathrm{damp}\)
- optical depth does depend on the thermal broadening parameter of the line, therefore we need to know temperature
- \(W\) grows grows excruciatingly slowly with optical depth, therefore trying to turn \(W\) into a measurement on \(N_l\) is very risky, since your error in \(W\) will propagate exponentially into an error on \(N_l\).
Square-root or “damped” portion
- so optically thick that even the Lorentzian wings “damping wings” are getting deep and contributing significantly to the equivalent width calculation \(\tau_0 \geq \tau_\mathrm{damp}\)
- after we’ve exceeded the damping optical depth column density \(N_l\) is again independent of thermal broadening parameter
For reference, you can walk through R&P Ch 2.4 or Draine Chs. 9.2, 9.3, and 9.4 for the calculations and approximations underlying these behaviors of the curve of growth.
Doublet ratios
If an absorbing level can transition to two different excited states \(u_1\) or \(u_2\), we can calculate the relative equivalent widths of those two transitions. This gives us confidence in assessing whether the transition is actually in the optically thin limit, and we can derive a more accurate result. E.g., you may see this for the Ca II K and Ca II H doublet transitions.
Lyman \(\alpha\)
In the ISM, atomic (neutral) hydrogen is almost always found in the ground state, and therefore the Lyman transitions are the most important. A resonance line is one that has permitted absorption out of the electronic ground state.
The Lyman \(\alpha\) transition \(1s \rightarrow 2p\) is very important because it allows us to directly measure the column density of atomic hydrogen.
Deuterium has a slightly frequency shifted Lyman series, which, in some cases, allows us to measure absorption lines for both hydrogen and deuterium, and therefore determine a D\H ratio for the interstellar/galactic gas.
Lyman limit
Happens as \(n \rightarrow \infty\) and the wavelength differences between adjacent transitions from ground state smush together. You get a bit of a “continuum” opacity that has a cross-section that is very similar to that of the photoionization we covered in previous lectures. This is because a transition from ground state to very high \(n\) is very similar to that of an ionization cross section.
Metal lines
Many resonance lines for metals are in the ultraviolet, so you can only observe them from space, or using optical means for highly redshifted systems. Notable exceptions are Na I doublet, the K I doublet, and the Ca II doublet.
Gas phase abundances
Observed abundances vary from sightline to sightline, which is presumably evidence that elements end up trapped in dust grains. This removal of various elements is called interstellar depletion.
- Warm neutral medium: has high abundances
- Cold neutral medium: has lower abundances
- Warm ionized medium: very high abundances
- Diffuse molecular clouds: very low abundances