Nebular Diagnostics
References
- Ryden and Pogge Ch. 4.4
- Draine Ch. 18
Goal: use emission features from an H II region or planetary nebulae to estimate its temperature and density
Ionized nebulae are far from blackbodies (not a terrible approximation for opaque bodies like stars). I.e., a blackbody absorbs all incident radiation and emits blackbody radiation.
A parcel of gas (say, containing neutral hydrogen atoms) can be in LTE (thermalized via collisions w/ free electrons) but not be a blackbody (i.e. emits via spectral lines, and continuum emission via free-free, free-bound, and two-photon emission).
Though the continuum emission does depend on density and temperature, because of the bright, spectrally concentrated nature of spectral line emission, this usually provides a more direct measurement.

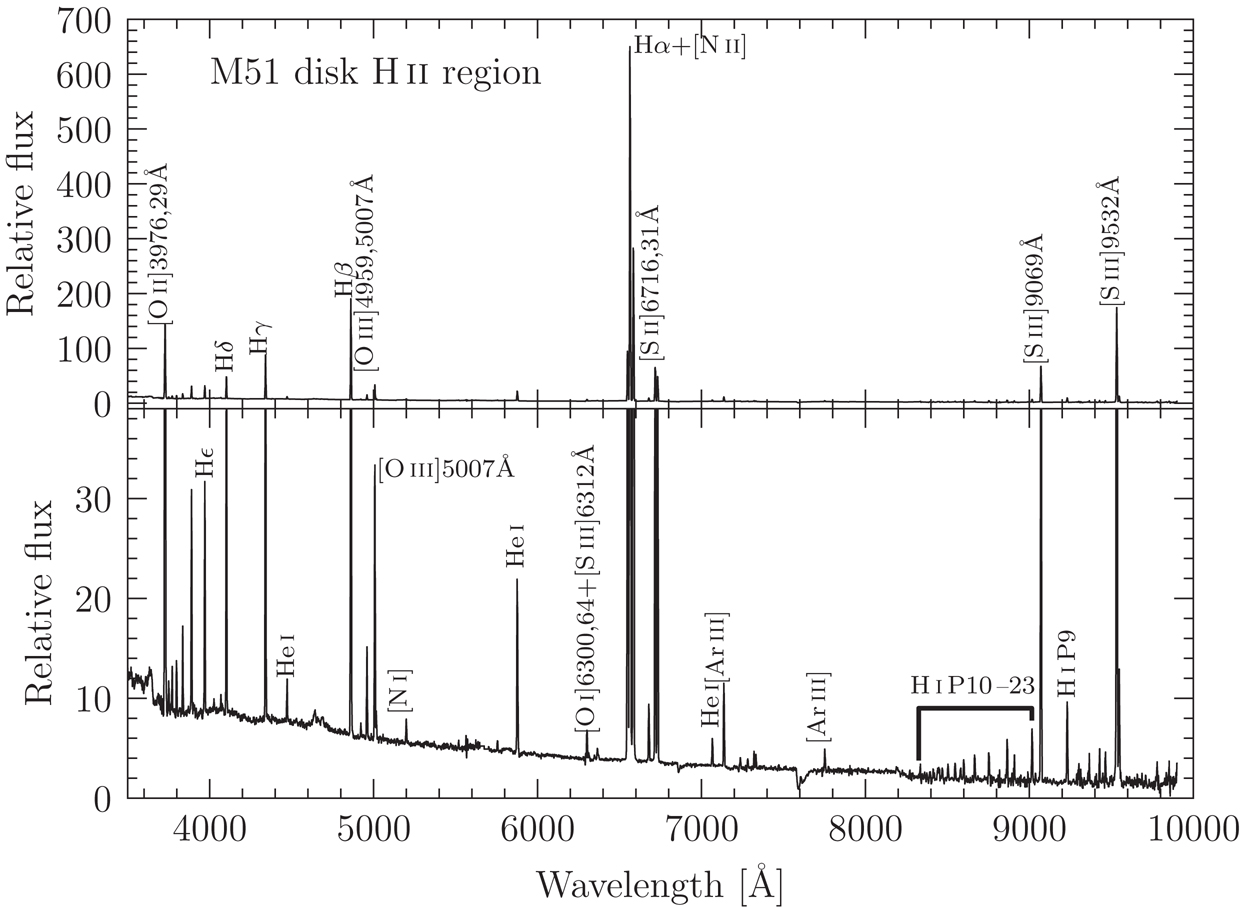
Spectrum of a disk H II region in the Whirlpoos Galaxy. The top panel shows the bright lines and the bottom panel is scaled to show the fainter lines. Credit: Ryden and Pogge Figure 4.5
Calculating temperature
A good rule of thumb for using emission lines is to find two excited states of the same ion (making sure you’re tracing the same conditions) whose energy levels differ by \(\sim k T\), where \(T\) is the temperature of the gas.
If \(T \sim 10^4\) K, then we’re looking for energy differences on the order 1 eV.
For H II regions, the following are useful
- doubly ionized oxygen O III
- singly ionized nitrogen N II
- doubly ionized sulfur S III
all of these have similar electronic structure, they are 4 electrons short of a filled outer shell and therefore their lowest energy levels have a similar form.

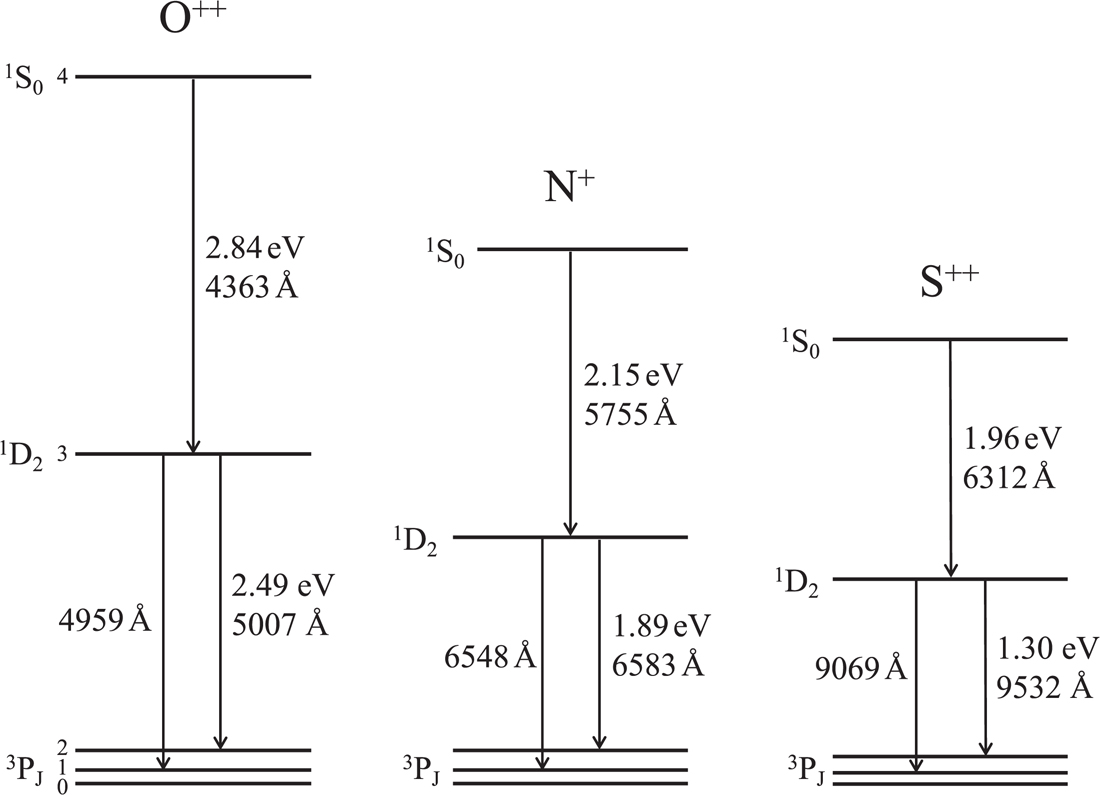
Energy levels of the ions O III, N II, and S III. Credit: Ryden and Pogge Figure 4.6
The ground state is \({}^3 \mathrm{P}_J\), which has fine structure sub-levels corresponding to angular momentum quantum levels \(J=0,1,2\).
The first excited state of the ion is written with \({}^1 \mathrm{D}\). A transition from this state to the \(J=1,2\) states of the ground state are forbidden magnetic dipole transitions, and the transition to the \(J=0\) is an even more strongly forbidden electric quadrupole transition.
Each of these transitions produce lines like [O III], [N II] that are in the optical band, and thus easily observable from the ground. These lines include those frequently termed “nebular lines” \({}^1 \mathrm{D} \rightarrow {}^3 \mathrm{P}_J \) (because they were first seen in planetary nebulae)
and “auroral lines” \({}^1 \mathrm{S} \rightarrow {}^1 \mathrm{D} \) because a similar line is seen in Earth’s aurorae. We number the different energy levels with numbers 0, 1, 2, 3, 4 for simplicity, so we don’t need to keep using the spectroscopic notation. There are higher energy levels to the ions, but at typical temperatures in ISM they are essentially unpopulated.
Now let’s calculate temperature from observed line strength. First, assume we are in the low-density limit such that
- \(n_e < n_\mathrm{crit} \) for each line under consideration
- meaning collisional excitation is followed by radiative de-excitation (not collisional de-excitation)
- radiative de-excitation will primarily be spontaneous instead of stimulated emission
The emissivity from spontaneous emission is $$ j_\nu = n_u \frac{A_{ul}}{4 \pi} h \nu_{ul} \Phi_\nu $$ so, integrated over the line profile, we have $$ j(4 \rightarrow 3) = n_4 \frac{A_{43}}{4 \pi} h \nu_{43}. $$
When we are in excitational equilibrium, the rate of collisional excitation from the ground state (remember, most things in ground state) to level 4 will be balanced by the radiative de-excitation from level 4.
For quantum mechanical reasons, transitions from 4 to 2 and 4 to 0 are strongly forbidden. Therefore we only need to take into account the transitions from 4 to 3 and 4 to 1 $$ n_0 n_e k_{04} = n_4 (A_{43} + A_{41}). $$ We can use this with the previous equation to include the collinional rate coefficient (and thus the temperature dependence) in the emissivity as $$ j(4 \rightarrow 3) = \frac{n_0 n_e}{4 \pi} k_{04} \frac{A_{43}}{A_{43} + A_{41}} h \nu_{43} $$ the temperature dependence comes in through the \(k_{04}\) term.
Now let’s consider the \(3\rightarrow 2\) line. Like the level 4 state, the level 3 state can be populated through direct collisional excitation, but it can also be populated through radiative de-excitation from the level 4 state. So, we would write
$$ j(3 \rightarrow 2) = \frac{n_0 n_e}{4 \pi} \left [ k_{03} + k_{04} \frac{A_{43}}{A_{43} + A_{41}}\right] \frac{A_{32}}{A_{32} + A_{31}} h \nu_{32}. $$
We can get rid of the dependence on density by taking the ratio of the line strengths $$ \frac{j(4 \rightarrow 3)}{j(3 \rightarrow 2)} = \frac{A_{43} \nu_{43}}{A_{32} \nu_{32}} \frac{(A_{32} + A_{31}) k_{04}}{(A_{43} + A_{41})k_{03} + A_{43} k_{04}}. $$ All of the \(A\) terms are known from quantum mechanics, and the collisional rate coefficients are dependent on temperature.
From the principle of detailed balance, we can relate the collisional rate coefficients by $$ \frac{k_{0u}}{k_{u0}} = \frac{g_u}{g_0} \exp \left (- \frac{h \nu_{u0}}{k T} \right). $$
In practice, there are some simplifications and factorizations that occur. First, we write the collision de-excitation rate cofficient as $$ k_{u0} = \frac{\beta}{T^{1/2}} \frac{\Omega_{u0}}{g_u} $$ where $$ \beta = \left ( \frac{2 \pi \hbar^4}{k m_e^3} \right)^{1/2} $$ and \(\Omega_{u0}\) is a dimensionless collision strength. \(\Omega_{u0}\) is nearly independent of temperature (and of order unity) so \(k_{u0} \propto T^{-1/2}\).
We can refactor the line strength ratios into $$ \frac{j(4 \rightarrow 3)}{j(3 \rightarrow 2)} = \frac{A_{43} \nu_{43}}{A_{32} \nu_{32}} \frac{(A_{32} + A_{31}) \Omega_{40} \exp(- h \nu_{43}/kT)}{(A_{43} + A_{41} \Omega_{30})+ A_{43} \Omega_{40} \exp(- h \nu_{43} / kT)}. $$ The temperature dependence is now isolated to the exponent. We’re going to get the most variation in the line ratios for temperatures \(kT \approx h \nu_{43}\), which is 1.96 eV for S III and 2.84 eV for O III.
Calculating density
To calculate density, its helpful to identify an ion with two electronic transitions that are similar in energy but have very different critical densities. One good example is singly ionized oxygen, O II.
Remember that critical density $$ n_\mathrm{crit} = \frac{(1 + n_\gamma) A_{ul}}{k_{ul}}. $$
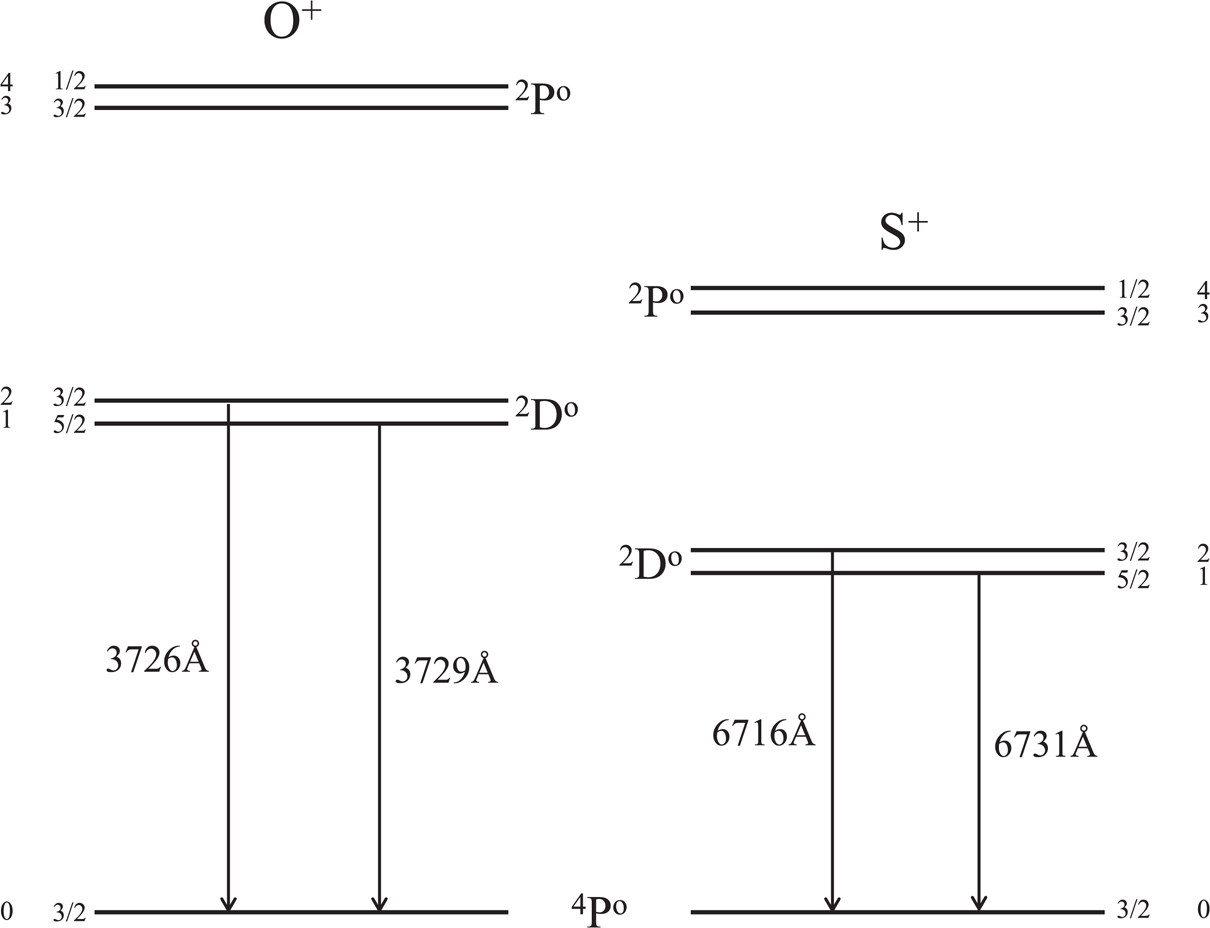
The first excited state \({}^2 \mathrm{D}^O\) is split into a pair of fine structure sub-levels, whose energies are finely separated. Thus, the transitions from the first excited state to ground produce a line doublet (two lines closely spaced in wavelength). The critical densities for the different lines of the doublet, however, are substantially different.

Energy levels of the O II and S II ions. Credit: Ryden and Pogge Figure 4.7
Following a similar path as before, we’ll write down the emissivities for each line of the doublet and then compute their ratios, and do some simplifications using collisional strengths to get
$$ \frac{j(2\rightarrow 0)}{j(1 \rightarrow 0)} \approx \frac{\Omega_{02}}{\Omega_{01}} \frac{1 + n_e/n_{\mathrm{crit},1}}{1 + n_e/n_{\mathrm{crit},2}}. $$
In the low-density limit, we have $$ \frac{j(2\rightarrow 0)}{j(1 \rightarrow 0)} \approx \frac{\Omega_{02}}{\Omega_{01}}, $$ the line ratios are independent of the free electron density \(n_e\).
In the high density limit, we have $$ \frac{j(2\rightarrow 0)}{j(1 \rightarrow 0)} \approx \frac{\Omega_{02}}{\Omega_{01}}\frac{n_{\mathrm{crit},2}}{n_{\mathrm{crit},1}}, $$ which is again independent of the free electron density \(n_e\) (but does depend on the critical densities of each transition).
To get something that does depend on the free electron density, we need to be in the regime where \(n_e\) is larger than one critical density but smaller than the other. For the O II transition we’ve been talking about, you can get line ratios that range from 0.4 to 1.4, which is a decent dynamic range.
And, of course, in a modern analysis, usually multiple temperature and density diagnostics are combined into a single estimate of temperature and density.
More details are in Ryden and Pogge, Ch 4.4.