HI Clouds: Observations, Heating and Cooling
References
- Draine Ch. 29, 30
- Ryden and Pogge Ch 1.3 and 1.4
H I Clouds: Observations
- 60% of gas in Milky Way is in H I regions (predominantly atomic H).
- Gas can be surveyed by 21-cm line (emission and absorption), absorption lines in spectra of stars, and infrared emission from dust mixed w/ hydrogen
- magnetic field in gas visualized through starlight polarized by aligned dust grains and in some cases Zeeman effect
H I 21-cm line observations
We covered a lot of this material when talking about excitation and atomic levels, but the following is a more observational picture.
One of the important pieces we derived from that lecture is that as long as 21-cm is optically thin, a measurement of the emission is a direct measure of the total column density of H I.
We also saw how if we have a background quasar, we could determine the spin temperature, which is normally close to the kinetic temperature of the gas.
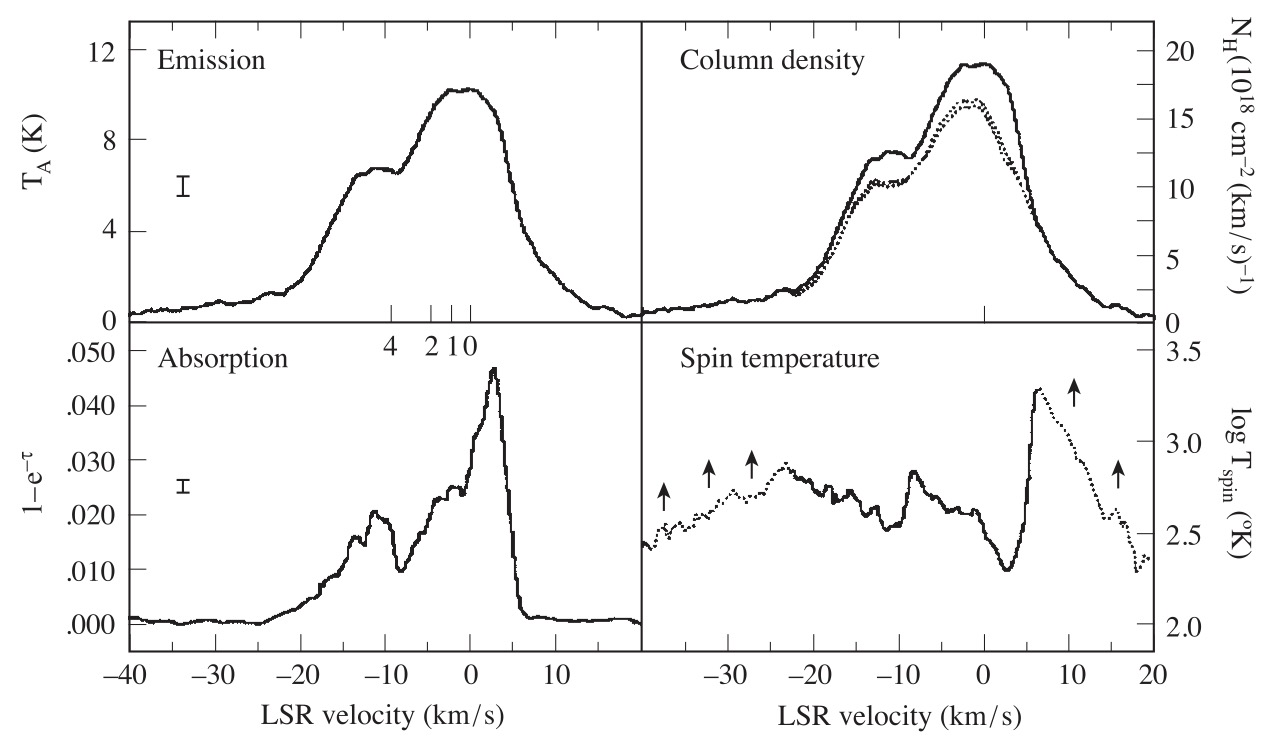
Let’s look at the following figure

Left panels: observed H I emission (OFF) and absorption (ON, towards quasar). Lower right: spin temperature as a function of LSR velocity. Tick marks of 0, 1, 2, 4 kpc show LSR velocity expected for a gas at those distances, assuming a Galactic rotation curve. Upper right: column density per velocity bin under different assumptions regarding the relative foreground/background locations of cold absorbing gas and warm gas seen only in emission. Credit: Draine 29.1, Originally Dickey et al. 1978
Surveys like these support the idea that (in the solar neighborhood), interstellar H I is found primarily in two distinct phases: cold neutral medium (cold absorbing gas) and warm neutral medium (warm gas seen only in emission).
Distribution of the H I
Differential rotation of gas in the Galactic disk means that regions of the Galaxy at different distances from the Sun will have different radial velocities. Therefore the 21 cm intensity vs. radial velocity chart can be used to map out distribution of H I in our Galaxy.
Zeeman effect
For the weak (5 microGauss) fields in the diffuse ISM, the Zeeman effect results in a small frequency shift between the left and right circularly polarized 21-cm emission. Observations are in general difficult.
Infrared emission
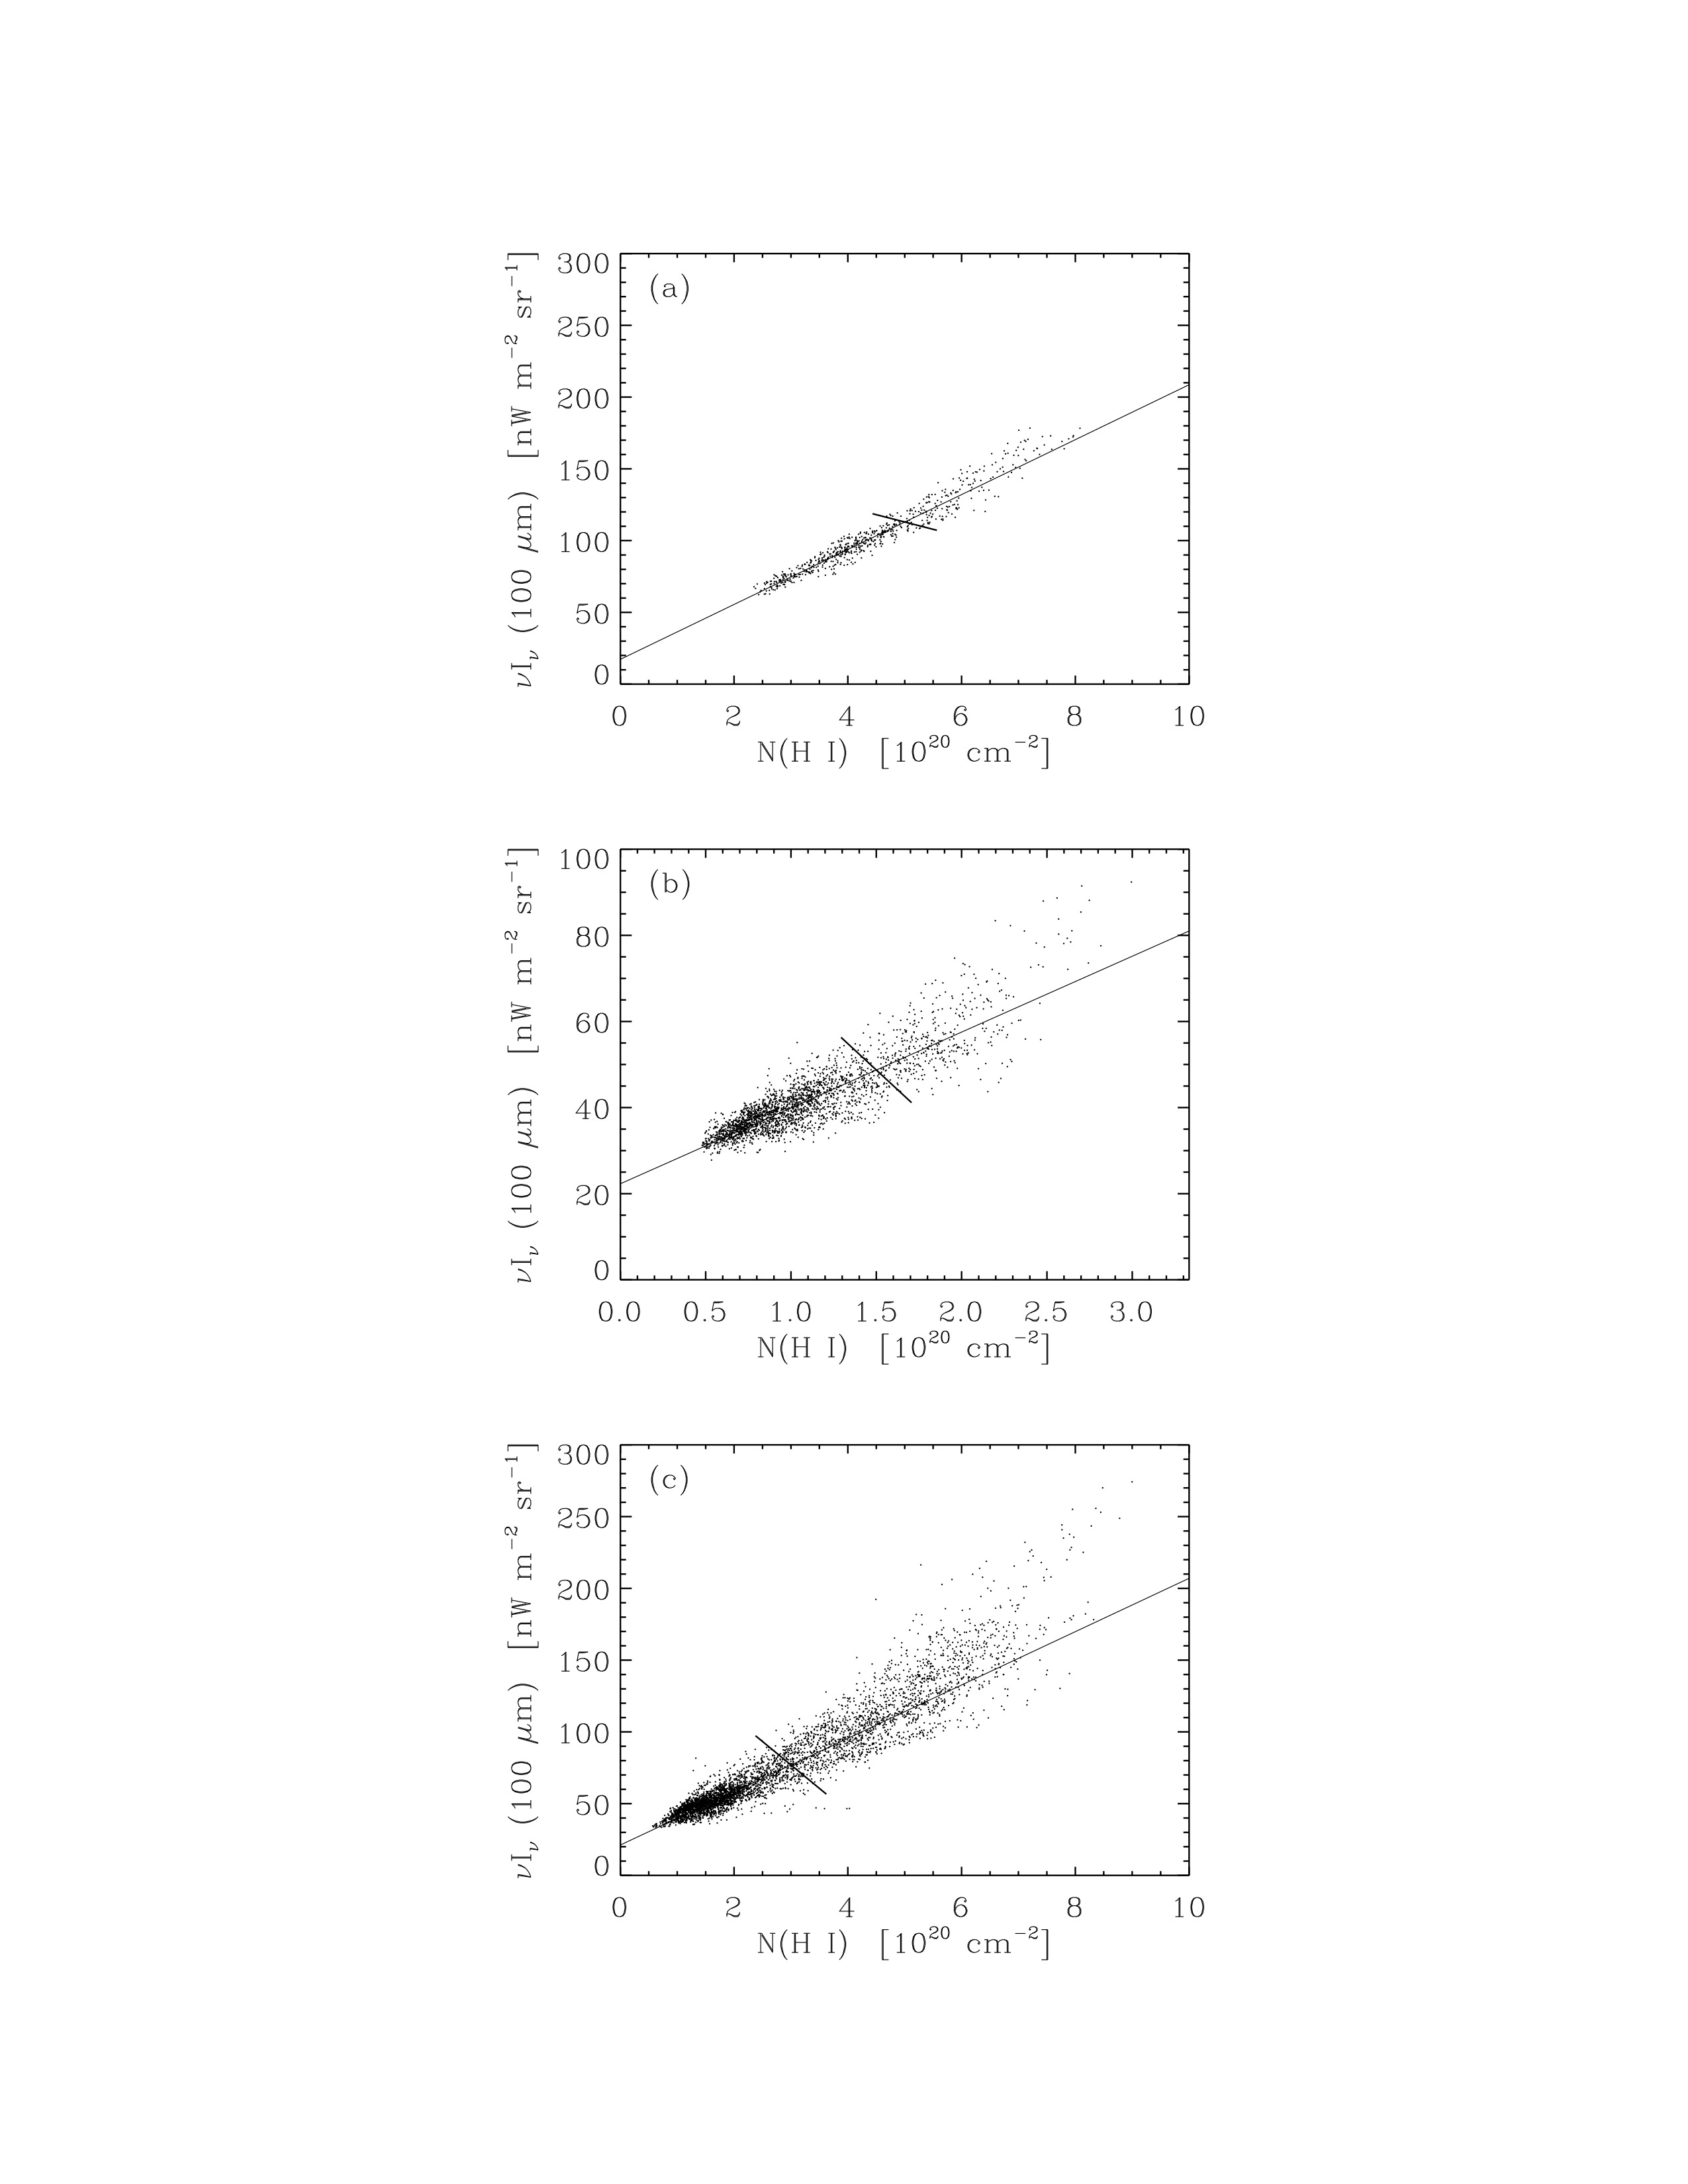
Dust is a tracer of the ISM because H I gas is dusty. In the dust chapter, we talked about the correlation between 100 micron emission and H I column density, as measured from 21-cm observations.

Credit: Draine Fig 29.4, originally Arendt et al. 1998.
The good correlation tells us that
- dust and gas are well-mixed
- starlight heating the dust must be fairly uniform
Heating and cooling in H I clouds
Most of the interstellar gas in the Milky Way is neutral, and 78% of the neutral hydrogen is atomic (not molecular).
Let’s examine the heating and cooling processes of H I so that we can estimate what temperatures we’d expect it to be at. We will find that, under some circumstances, the ISM can be thought of as two distinct phases in pressure equilibrium.
Heating
Heating mechanisms include
- ionization by CRs
- Photoionization of H and He by x-rays
- Photoionization of dust grains by starlight UV
- Photoionization of metals like C, Mg, Si, Fe, etc. by starlight UV
- Heating by shock waves and other MHD phenomena
Photoelectric heating by dust
Photoelectrons emitted by dust grains dominate the heating of diffuse H I in the Milky Way. Large neutral carbonaceous grains can in principle be photoionized by photons with energies down to 4.5 eV.
Small grains account for most of the UV absorption and photoelectric yields are enhanced for small grains, so therefore the photoelectric heating rate is dominated by photoelectrons from very small grains, including the PAHs.
Cooling via [C II] 158 microns, [O I] 63 microns, and other lines
For temperatures above 10^4 K, the cooling is dominated by two fine structure lines [C II] 158 microns, [O I] 63 microns.
The critical densities for these lines are high, implying that collisional deexcitation is unimportant in the diffuse ISM of the Milky way.
Two phases for H I in the ISM
Now let’s investigate what thermal equilibrium looks like in an H I region. As before, we require a balance between heating and cooling $$ \Gamma(T_\mathrm{eq}) = \Lambda(T_\mathrm{eq}). $$
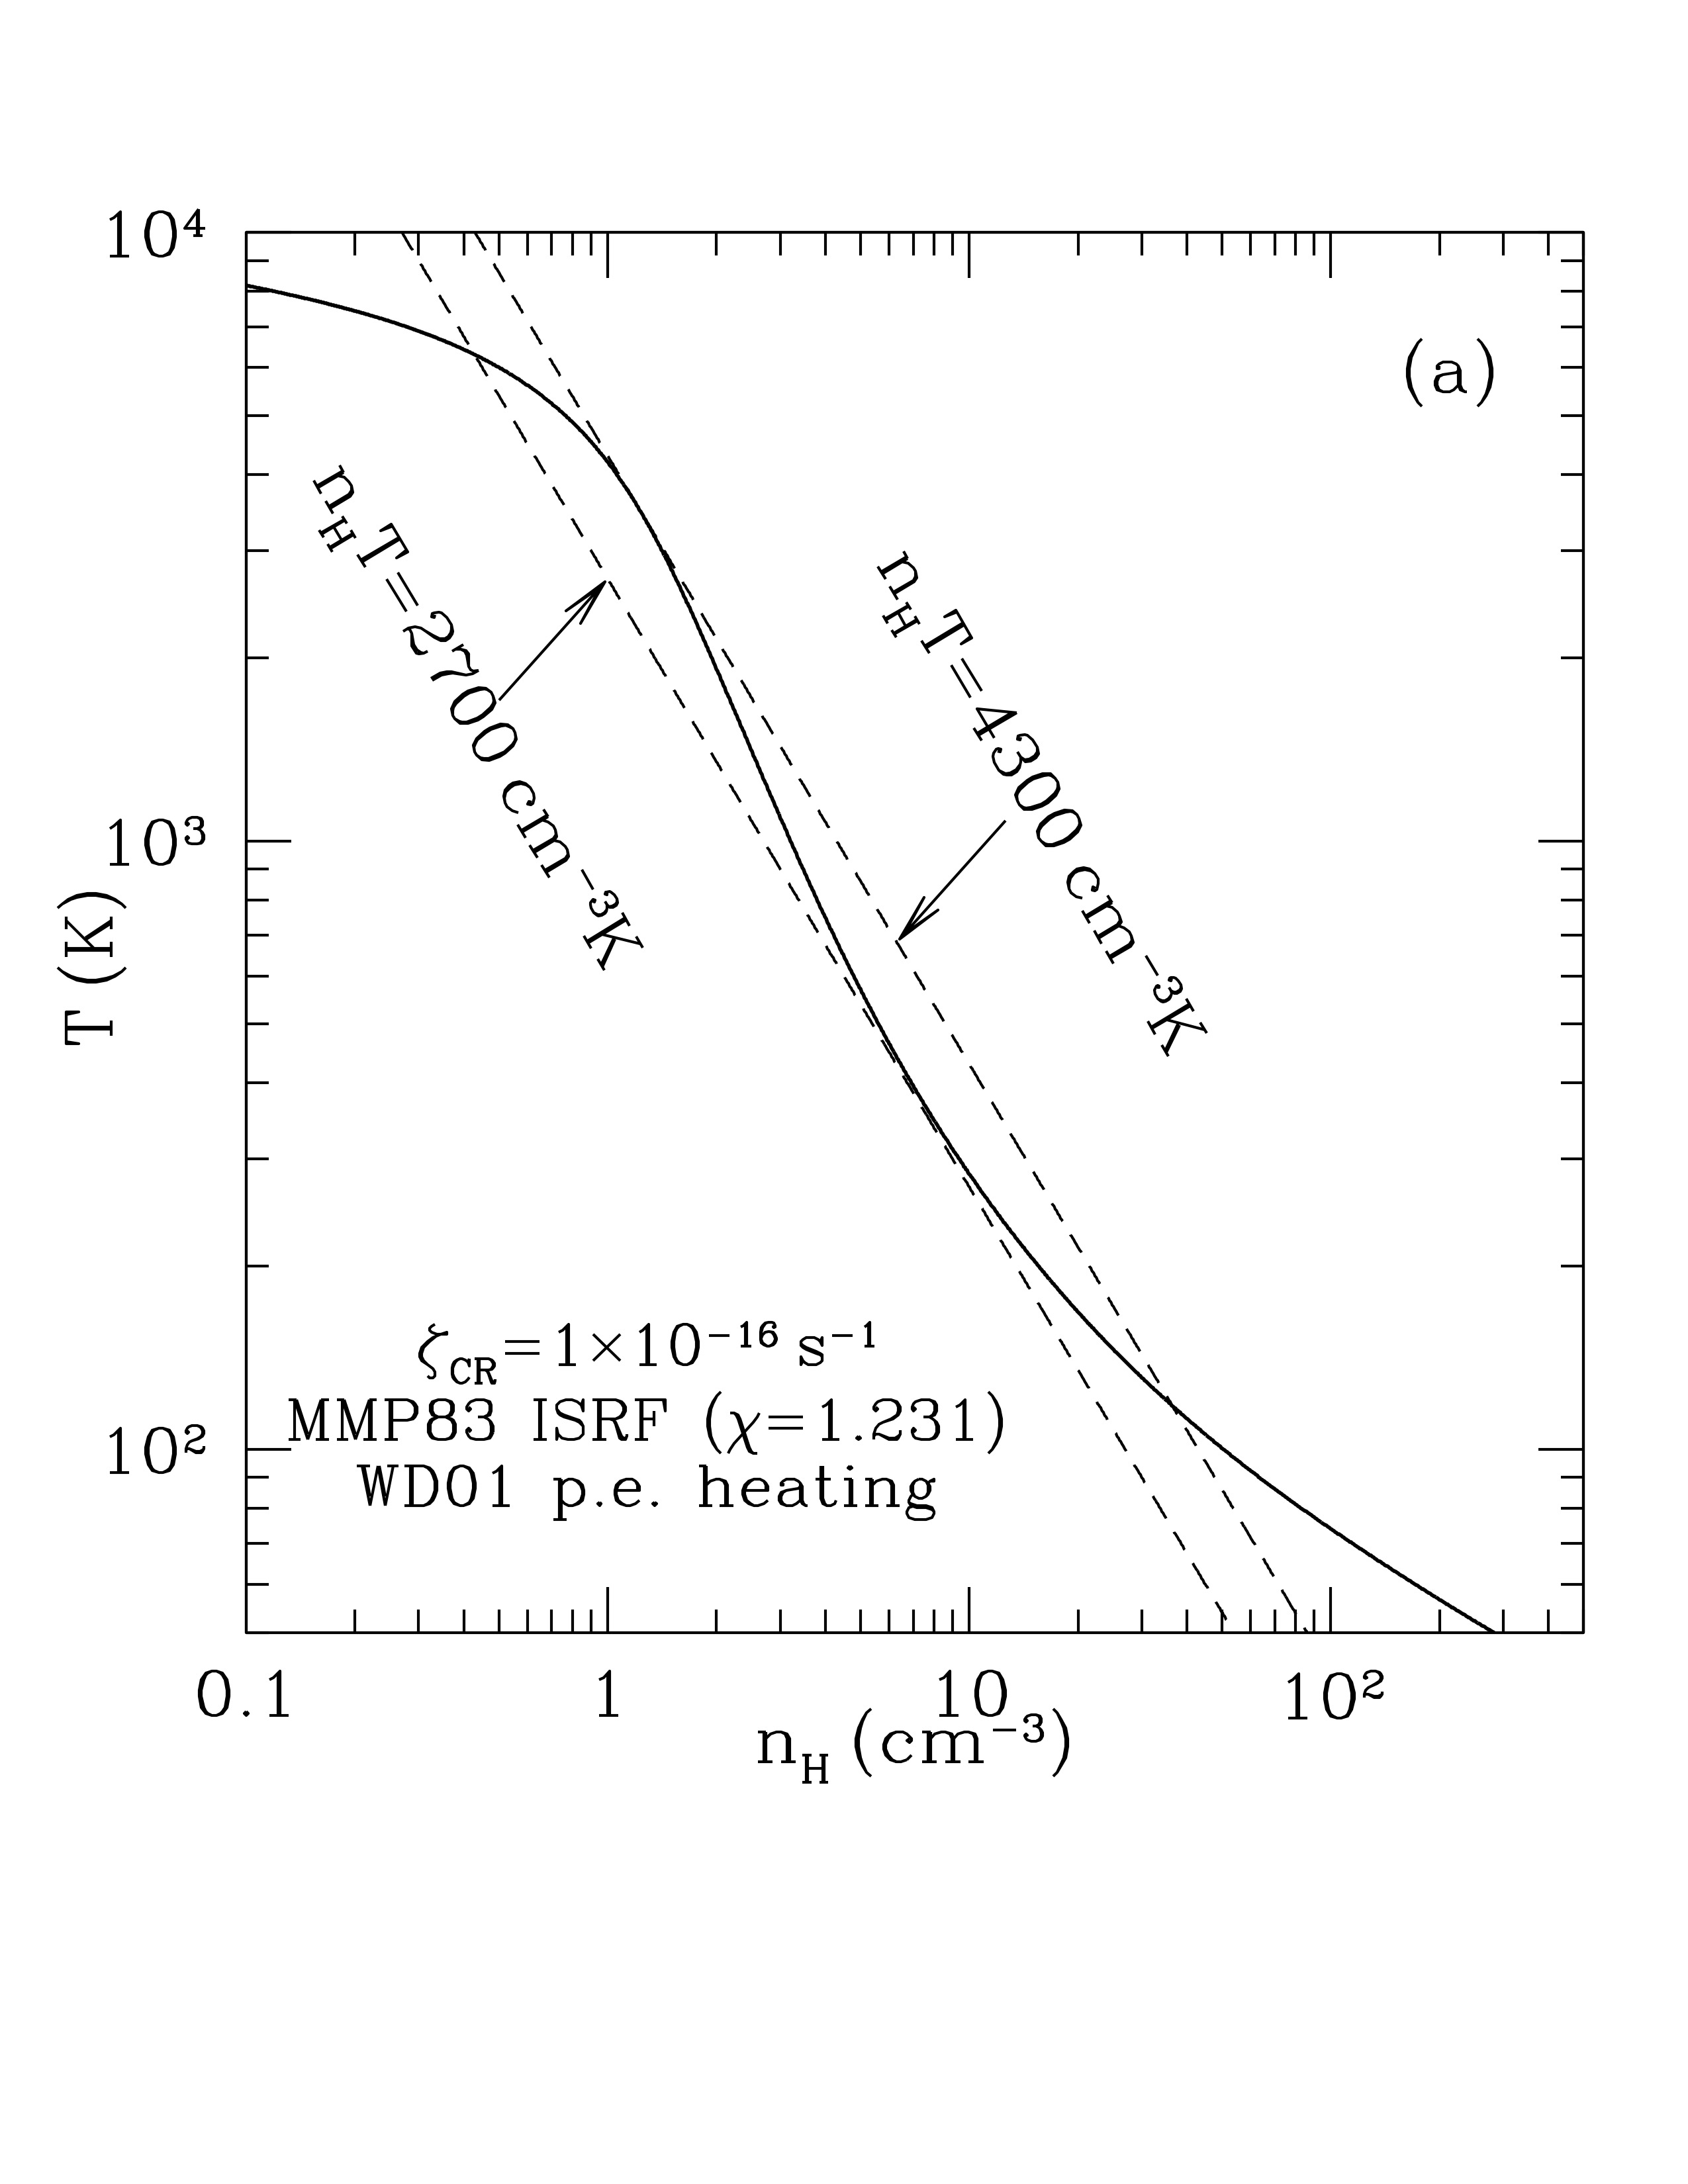
First, let’s examine how the steady state temperature \(T_\mathrm{eq}\) varies as a function of density \(n_H\).

The steady state temperature as a function of density, for gas heated by cosmic rays and photoelectric heating by dust grains. Two lines of constant \(n_H T\) are shown. Credit: Draine Fig 30.2a
As we see, the equilibrium temperature is a monotonically decreasing function of \(n_H \). This is because of the line-cooling mechanisms, which are throttled by how quickly atoms can be collisionally excited (to be line-radiated away).
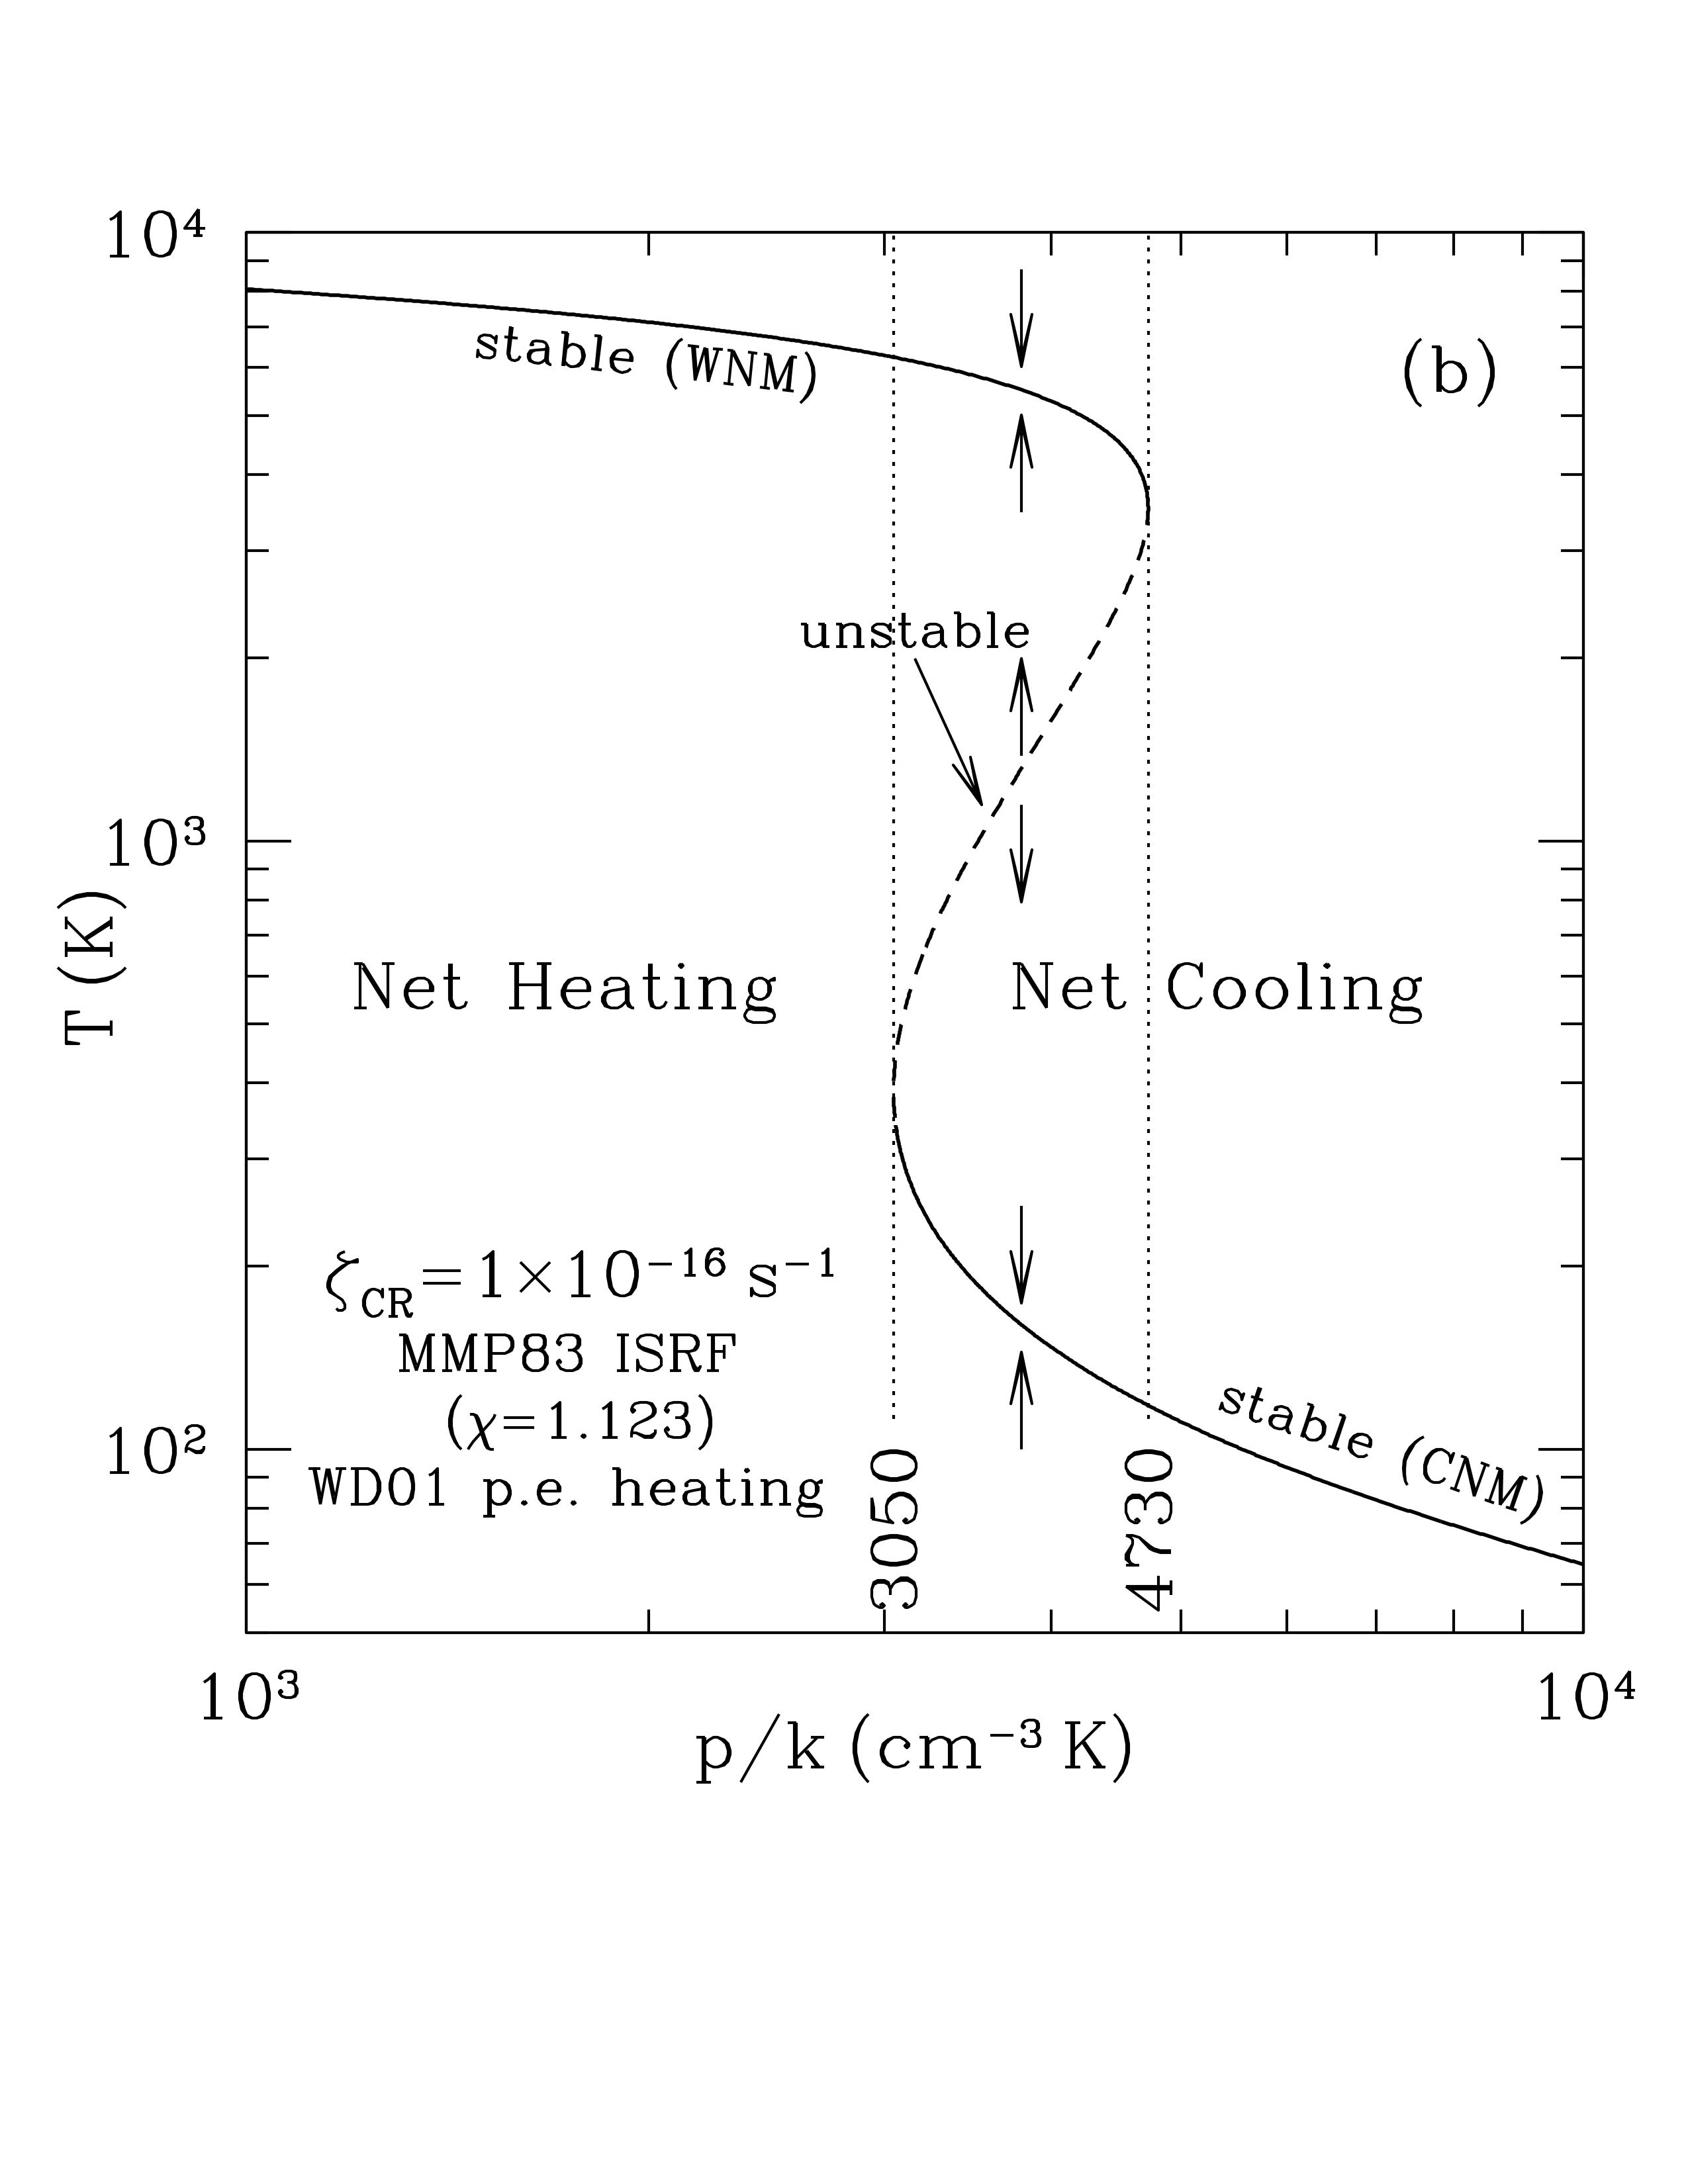
Now, let’s examine the solution for equilibrium temperature when we fix the pressure $$ p = n k T. $$ Fixing the pressure is saying that things are in dynamic equilibrium, because if there was a pressure imbalance, then things would move to equalize pressure (the way wind blows from a high pressure system to a low pressure system on earth).
- We see that at low pressures the heating balances cooling at 6000 K (which correspond to WNM conditions).
- We see that at high pressure the heating balances cooling at 100 K (corresponding to CNM conditions).
When you combine a heating gain \(\Gamma\) that is independent of gas temperature with a cooling function \(\Lambda(T)\) that is not a simple power law, you get multiple phases of the ISM in pressure equilibrium with each other.

The steady state temperature as a function of thermal pressure \(p\). For pressures in the range between the two dotted lines, there are three possible equilibria temperatures: a high temperature WNM solution, a low temperature CNM solution, and an intermediate temperature equilibrium that is unstable. Credit: Draine Fig 30.2b
At intermediate pressures, for a given pressure, there are three possible solutions for equilibrium temperature. The upper and lower solutions are stable (if perturbed away from equilibrium temperature, it will return to it). But the intermediate solution is unstable:
- if perturbed upward, it will warm to the stable WNM setup
- if perturbed downward, it will cool to the stable CNM setup
So, given our best estimates of cosmic ray ionization, photoelectric heating, and cooling processes in the diffuse ISM, we conclude that an ISM in thermal equilibrium and dynamic equilibrium (equal pressure) would have two distinct phases, provided the pressure is in between the two vertical lines (otherwise would just have one phase).
This is called the “two-phase” ISM model, and was first developed by George Field in 1969. Later revisited a number of times with differing assumptions about grain photoelectric heating, grain-assisted recombination, inelastic collisional cross-sections for cooling processes, and coolant abundances. So, the “two-phase” model has a long and storied history in ISM study. McKee and Ostriker 1977 expanded this to the “three-phase” ISM, with the hot ionized medium, where bremsstrahlung is the chief cooling process.
Observationally, the different phases will have different emission spectra.
First, the dust emission at 100 microns will be the same for both phases, since the dust is heated by the same radiation field. But, the line emission will vary considerably. For the CNM, the strongest coolant is [C II] 150 microns. For the WMN, the strongest coolant is [O I] 63.2 microns.