The Fourier Transform II
References for today
- The Fourier Transform and its Applications by R. Bracewell
- Interferometry and Synthesis in Radio Astronomy by Thompson, Moran, and Swenson, particularly Appendix 2.1
- Fourier Analysis and Imaging by R. Bracewell
- Wikipedia on Nyqist-Shannon sampling theorem
Review of last time
Defined Fourier transform, inverse $$ F(s) = \int_{-\infty}^{\infty} f(x) e^{-i 2 \pi x s}\,\mathrm{d}x $$
Note that because \(x\) and \(s\) appear in the argument of the exponential, their product must be dimensionless. This means that they will also have inverse units, e.g., “seconds” and “cycles per second.”
Introduced convolution, impluse symbol, and theorems
Where are we headed today?
- Finish up Fourier transform theorems
- Nyquist sampling theorem
- Discrete Fourier Transform
Continuing from last time: Fourier transform theorems
Convolution/multiplication
The convolution of two functions corresponds to the multiplication of their Fourier transforms.
If
$$ f(x) \leftrightharpoons F(s) $$
and
$$ g(x) \leftrightharpoons G(s) $$
then
$$ f(x) * g(x) \leftrightharpoons F(s)G(s). $$
This is an extremely useful theorem. At least in my career, this, and concepts related to sampling, have been the ones I have used the most often. You may have already used this theorem (numerically) if you’ve ever carried out a convolution operation using scipy.signal.fftconvolve in Python, which can be dramatically faster than directly implementing the convolution, at least for certain array sizes.
Rayleigh’s theorem (Parseval’s theorem for Fourier Series)
The amount of energy in a system is the same whether you calculate it in the time domain or in the frequency domain.
The integral of the mod-squared of a function is equal to the integral of the mod-squared of its spectrum
$$ \int_{-\infty}^\infty |f(x)|^2\,\mathrm{d}x = \int_{-\infty}^\infty |F(s)|^2\,\mathrm{d}s. $$
Autocorrelation theorem
The autocorrelation of a function is
$$ f(x) * f(x) = \int_{-\infty}^\infty f^{*}(u) f(u + x)\,\mathrm{d}u $$
and it has the Fourier transform $$ f(x) * f(x) \leftrightharpoons |F(s)|^2. $$
Thus, the power spectrum is the Fourier transform of the autocorrelation function. It can also be computed directly by taking the “mod-squared” of \(F(s)\),
$$ |F|^2 = F F^*. $$
If you’ve ever worked with (stationary) Gaussian processes (e.g., squared-exponential, Matern, etc…), you might recognize this relationship between the autocorrelation (the kernel function) and the power spectrum of the Gaussian process.
The derivative theorem
If
$$ f(x) \leftrightharpoons F(s) $$
then
$$ f^\prime(x) \leftrightharpoons i 2 \pi s F(s). $$
Using the transform pairs
Now that we have a few basic transform pairs, and some of the transform theorems, you can mix and match these to build up a library of new transform pairs. You will explore this in the problem set.
Definite integral
The zero-valued frequency of a Fourier transform is equal to the definite integral of a function over all space
$$ \int_{-\infty}^\infty f(x)\,\mathrm{d}x = F(0). $$
I.e., to compute the area under the curve, you can just read off the zero-frequency value of the Fourier transform.
First moment
The first moment of \(f(x)\) about the origin is
$$ \int_{-\infty}^\infty x f(x)\,\mathrm{d}x $$
Using the derivative theorem (not shown), you can determine that the first moment \(\bar{f}\) is
$$ \bar{f} = \int_{-\infty}^\infty x f(x)\,\mathrm{d}x = \frac{F^\prime(0)}{-2 \pi i} $$ i.e., the slope of the Fourier transform evaluated at \(s = 0\), times \(-1/2 \pi i\).
Second moment
Second moment (moment of inertia) is given by
$$ \int_{-\infty}^\infty x^2 f(x)\,\mathrm{d}x = -\frac{1}{4 \pi^2} F^{\prime\prime}(0). $$
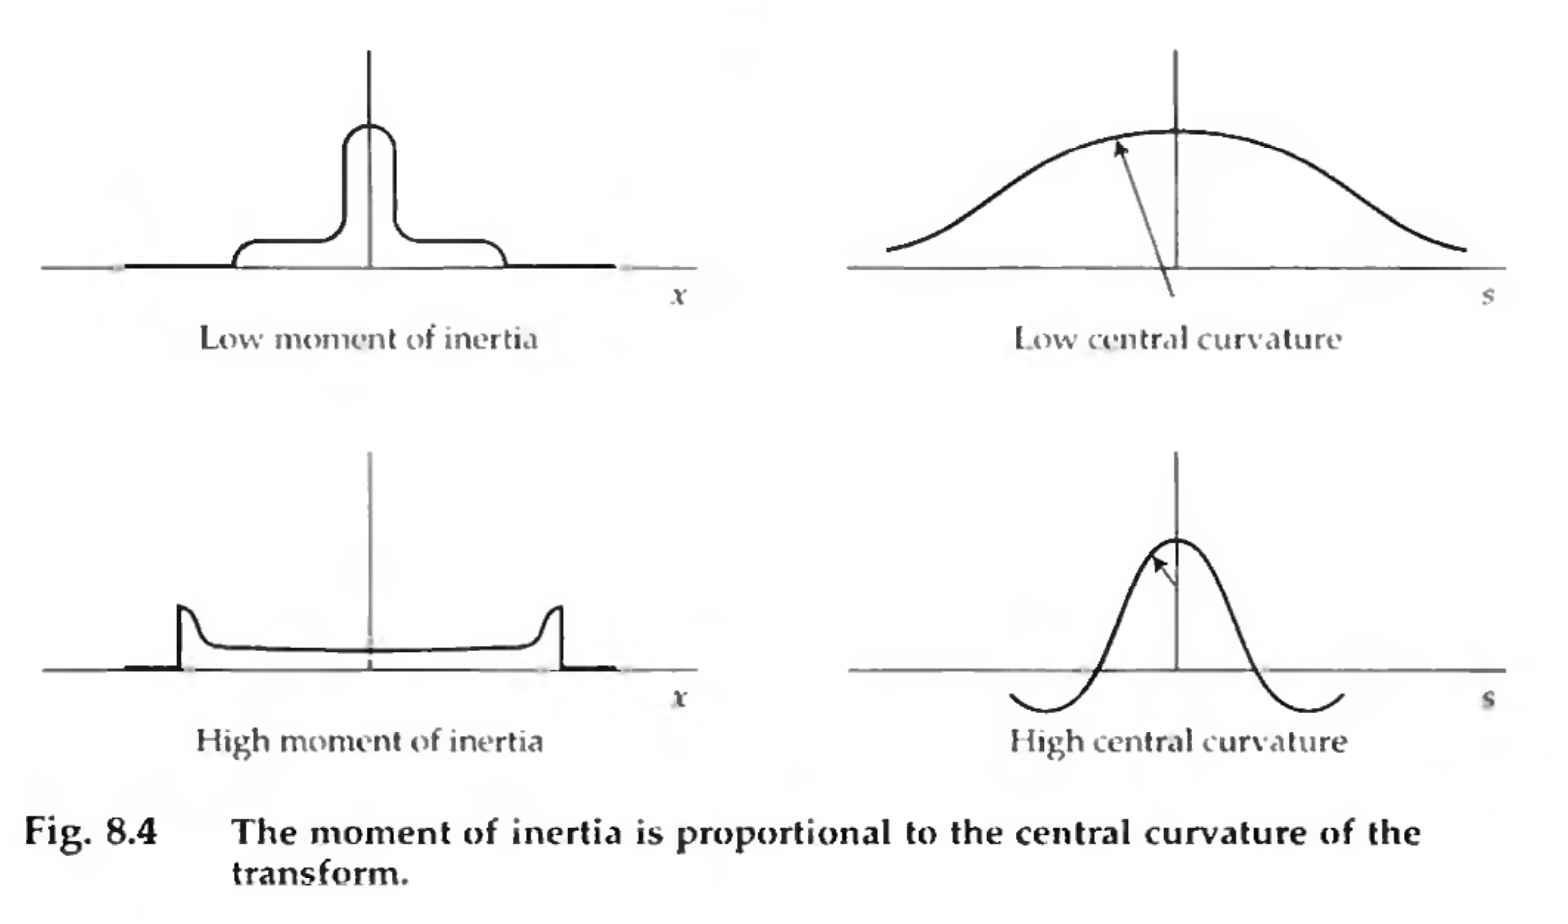
Credit: Bracewell Fig 8.4
Similar arguments extend to variance \(\sigma^2\) as we had mentioned with regards to the uncertainty principle.
Smoothness and compactness
In general, the smoother a function is in the time domain, the more compact its Fourier transform will be in the frequency domain.
Smoother functions will have a larger number of continuous derivatives. Something like the Gaussian envelope \(\exp(-\pi x^2)\) is “as smooth as possible” and therefore its Fourier transform (also a Gaussian envelope) is as compact as possible.
Filters and transfer functions
Time domain
We can say that we have some (electrical) waveform $$ V_1(t) = A \cos (2 \pi f t) $$ which is a single-valued function of time. You can think of this as a voltage time-series or another physical quantity. By definition, the waveform is real.
Let’s put on our electrical/acoustical/mechanical engineering hats for a moment and consider that a filter is a physical system with an input an and output, e.g., something that is transmitting vibrations or oscillations, like our waveform.

How a filter changes the amplitude and phase of an waveform. Credit: Ian Czekala
If we feed our waveform into a linear filter, we get output $$ V_2(t) = B \cos (2 \pi f t + \phi). $$
The output is still a waveform, but its amplitude and its phase have changed. These changes are likely frequency dependent, too.
We can specify the filter by a frequency-dependent quantity \(T(f)\) called the transfer function. It is a complex-valued function (having both an amplitude and a phase) and is given by $$ T(f) = \frac{B}{A}e^{i \phi}. $$
Interesting, perhaps, but maybe not immediately obviously useful. Let’s introduce the spectrum and then circle back to the transfer function.
Obtaining \(V_2\) using the frequency domain
The spectrum of the waveform is the Fourier transform of \(V(t)\), which we’ll call \(S(f)\) in this section. We’ve broken slightly from our \(f \leftrightharpoons F\) notation, but \(V \leftrightharpoons S\) is a classic in the signal processing and electrical engineering fields, so we’ll at least build familiarity with it in this example.
The “spectrum” here is just the Fourier transform quantity, it can definitely be complex-valued.
The “spectra” that we typically talk about in astrophysics are measurements of the electromagnetic spectrum—you’ve probably never come across as one that’s complex-valued, right? What’s going on here?
Consider the units of a flux measurement \(F_\nu\) of the electromagnetic spectrum. In lecture 1, we covered that the cgs units of flux are $$ \mathrm{ergs}\;\mathrm{s}^{-1}\;\mathrm{cm}^{-2}\;\mathrm{Hz}^{-1}. $$
The clue is in the \(\mathrm{ergs}\;\mathrm{s}^{-1}\) part, which we could also write in terms of “watts” if we wanted to be strictly S.I. about it. When we are measuring the electromagnetic spectrum, we are actually measuring the power spectral density, \(|F(\nu)|^2\). The absolute squared means the quantity \(|F(\nu)|^2\) is real-valued, and is the reason why you never hear about measurements of the electromagnetic spectrum containing imaginary values!
In this course, at least, we’ll try to be explicit about which spectrum we’re referring to. When we actually mean power spectrum, we’ll try to call it as such. Otherwise, “spectrum” will refer to a quantity like \(S\).
Now, let’s revisit our filter example, where we had input and output \(V_1(t)\) and \(V_2(t)\) respectively. From our discussion, we also have
$$ V_1 \leftrightharpoons S_1 $$ and $$ V_2 \leftrightharpoons S_2. $$
The transfer function concept is especially useful when we think about the spectrum of the waveforms, because we have $$ S_2(f) = T(f) S_1(f). $$
I.e., the spectrum of the output waveform is simply the spectrum of the input waveform multiplied by the transfer function.
Once you have \(S_2\), then you can get \(V_2(t)\) from $$ V_2 \leftrightharpoons S_2. $$
Two examples are low-pass and high-pass filters.
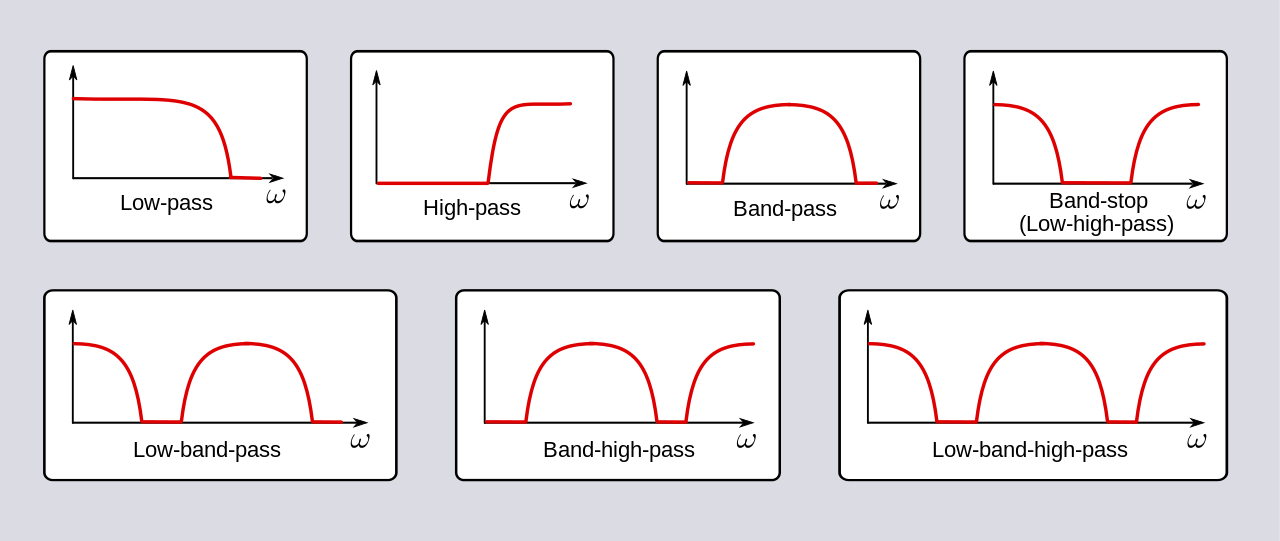
Examples of different filter transfer functions \(T(f)\). Credit: Wikipedia/SpinningSpark
Obtaining \(V_2\) using the time domain
Now let’s think of digital signal processing, where you wanted to practically apply a filter to some waveform to produce a new waveform. As we just outlined, you could acquire \(V_1(t)\), Fourier transform it to access its spectrum \(S_1(f)\), multiply by the transfer function \(T_(f)\), and then do the inverse Fourier transform to get \(V_2(t)\). Is there a way to do this directly in the time domain? What if you don’t have the complete waveform all at once?
The answer is provided by the convolution theorem for Fourier transforms. Since the transfer function is applied via a multiplication in the Fourier domain, we could equivalently carry out the same operation by a convolution in the time domain.
The convolutional kernel would be $$ I(t) \leftrightharpoons T(f) $$ and we’d have $$ V_2(t) = I(t) * V_1(t). $$
To summarize, Credit Bracewell, Chapter 9.
Determining \(I(t)\)
If you had some system already in place, and you wanted to determine \(I(t)\) experimentally, what is one way you could do it? What waveform could you send the system?
One simple option would be to send $$ V_1(t) = \delta(t), $$ then $$ V_2(t) = I(t) * \delta(t) = I(t). $$
Nyquist-Shannon sampling
- Youtube/SteveBrunton on The Sampling Theorem
Thus far we have been talking about continuous functions. As astrophysicists, though, we’re frequently dealing with discrete data points, which are presumed to be samples of some unknown function. Maybe you’re the one designing the experiment to capture these data points, or maybe you’ve just been handed some dataset.

Say you are given a set of (noisless) samples that look like this. What do you think the function should look like in between the points? Credit: Ian Czekala
Concisely put, the sampling theorem states that under a certain condition, a function can be completely reconstructed from a set of discrete samples—without information loss. I.e., the set of discrete samples is fully equivalent to having access to the full set of function values. Today, this sampling theorem is known as the Nyquist-Shannon sampling theorem, the Whittaker–Nyquist–Shannon theorem, or simply “the sampling theorem.”
If we were to try to use these data points to actually reconstruct a function, then what sort of constraint would we need to impose on the function? We’d want to place some constraint on its spectrum, i.e., that there are no higher frequency components oscillating around faster than our sampling points.
Before we dive into the derivation of the sampling theorem, let’s first take another look at what can go wrong when you undersample a time series.
Aliasing

If the true signal is given by the solid line, but we undersample it, then the sine-wave we naively reconstruct from the samples would have the wrong frequency. Here we would say that the higher frequency signal has been aliased into the lower frequency range. Credit: Wikipedia Pluke
This is also called the Stroboscopic effect. There are some nice examples online:
- Youtube/SmarterEveryDay.
- Stationary helicopter.
- Exoplanet transits! Dawson and Fabrycky 2010 find a shorter period for the exoplanet 55 Cnc e, previously confounded by the timing of the RV observations.
Derivation of sampling theorem
Now, let’s use our understanding of Fourier transforms and the sampling/replicating function to develop a precise formulation of the sampling theorem.
Recall that the “shah” function is an infinite series of delta functions spaced a unit dimension apart, and that it is its own Fourier transform $$ \mathrm{shah}(x) \leftrightharpoons \mathrm{shah}(s). $$
Via the similarity theorem, if the delta functions of the shah get closer in the \(x\) domain, then they spread out in the Fourier domain, and vice-versa.
We can adjust the spacing of the samples by dilating or shrinking the shah function by some factor. Here, we’ll write this as the sampling interval \(\Delta x = \tau\) or the sampling frequency \(1/\tau\).
According to the similarity theorem, adjusting the sampling frequency in the \(x\) domain has the following effect in the frequency domain $$ \mathrm{shah}(x/\tau) \leftrightharpoons \tau \mathrm{shah}(\tau s). $$
For example, if \(\tau = 0.2\), then we have

The shah function is its own Fourier transform. Via the similarity theorem, if we compress the shah function in the time domain (left), we expand it in the Fourier domain (right). Credit: Bracewell, Fig 10.3
Now let’s consider a function and its Fourier transform

A generic function (left) and its Fourier transform (right). We say that this function is ‘band-limited’ because its Fourier transform is 0 for all frequencies below some cutoff frequency \(|s| < s_c\). Credit: Bracewell Fig 10.2
As before, we will use multiplication by the shah function to represent sampling of the function.
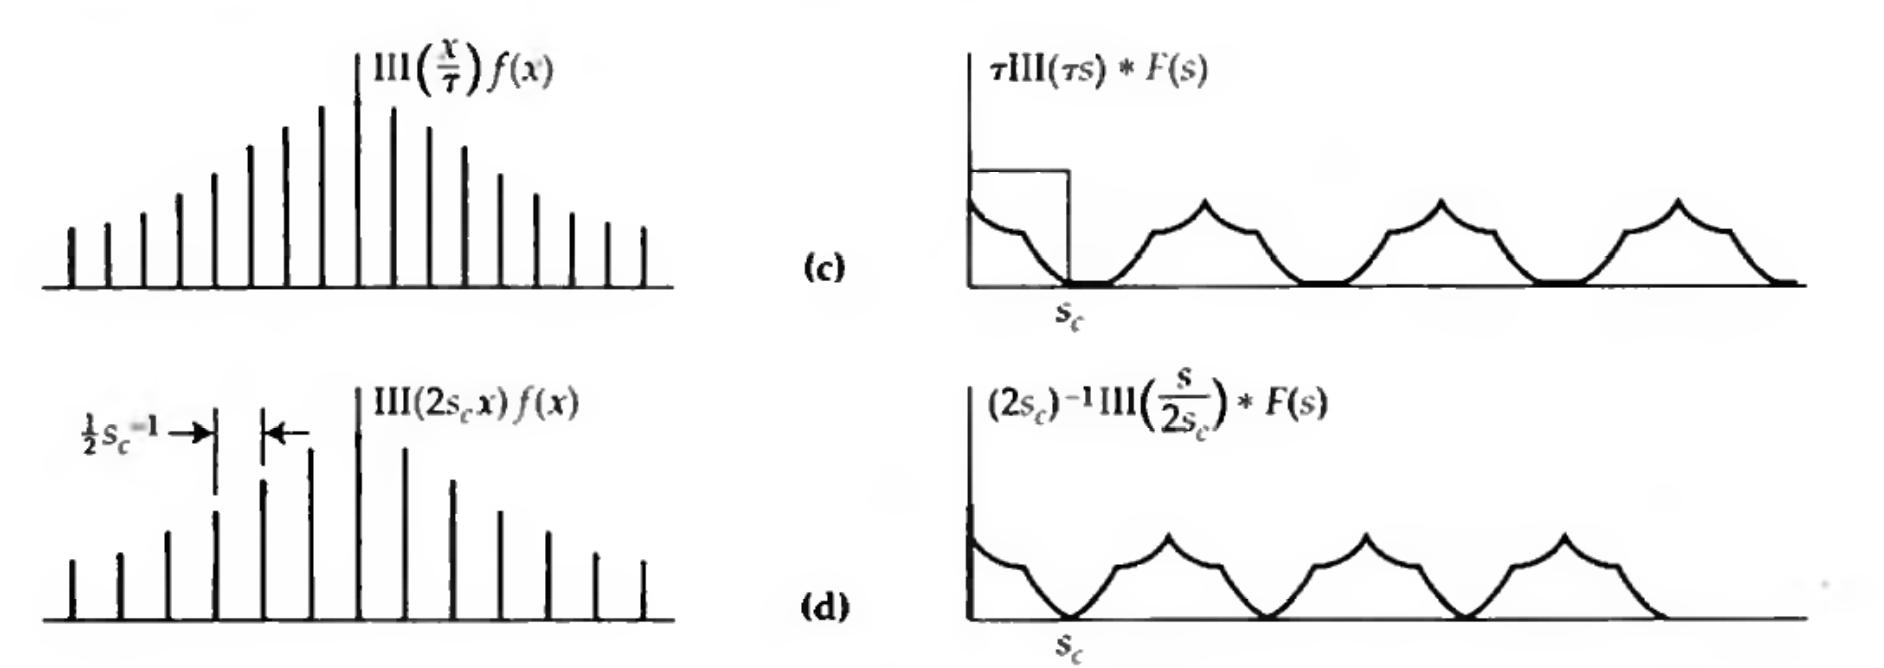
Left: the sampled version of \(f\), which has the Fourier transform on the right. So long as the sampling frequency exceeds twice the cutoff frequency, the Fourier transform ‘islands’ do not overlap (top two rows). Credit: Bracewell Fig 10.3
The non-overlappingness of the ‘islands’ is the key to properly sampling a function, and we’ll see why in a moment when we talk about reconstruction. But first, let’s make a quantitative statement of the sampling theorem (Bracewell):
If \(s_c\) is the cutoff frequency defining the band-limited nature of the signal, then so long as the function is sampled at equal intervals not exceeding \(\Delta x = 1/(2 s_c)\) then the function is properly sampled, i.e. $$ \frac{1}{\tau} \geq 2 s_c. $$
Restoration of signal kernels
Now let’s talk about how we would actually reconstruct the continuous function from a set of samples. Let’s re-examine our plot of the Fourier domain

Credit: Bracewell Fig 10.3
The “function” on the left is technically not the same (continuous) function that we started with, it is a discrete representation of it. We did just say, though, that if the function was band-limited, then these samples contained all of the same information as if we had access to the full function. So how do we go from these samples back to the full function?
Let’s look at the Fourier side of this plot and compare it to the original Fourier side. The main difference is that this Fourier plot has repeating ‘islands’ at progressively higher frequencies, essentially to infinity. How can we get rid of these higher frequency islands?
The answer is to multiply by a boxcar function in Fourier domain, completely truncating these higher order terms. Then, we can do the inverse Fourier transform and recover the original, continuous function.
What is the analogous operation for the time-domain? This is the same thing as we discussed with the transfer function. Since it was a multiplication in the Fourier domain, it is a convolution in the time domain. And the convolutional kernel is the Fourier transform of the boxcar, which is a sinc function.
So, to exactly reconstruct a band-limited function from a set of samples, we do sinc-interpolation.
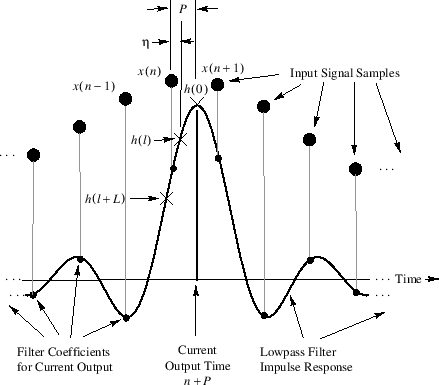
Credit: DSP related.
Undersampling and aliasing
If we didn’t sample the function at a sufficiently high rate, then we would have overlapping islands. Essentially, the higher frequency components of the Fourier islands are “folded-over” back into the range of frequencies we thought was band-limited, resulting in a corrupted signal.
In an alias, a higher frequency signal is masquerading as a lower-frequency signal.

Credit: Bracewell Fig 10.3
Compressed sensing
You may have heard of “compressed sensing,” which is one of major signal processing results of the last few decades. The idea is that you can reconstruct a functional form using far fewer samples than required for the Nyquist rate, using some dictionary of functional forms, or knowledege that the signal may be sparse. You can, indeed, perfectly reconstruct the signal through optimization using the \(L_1\) norm. If you don’t want to make the assumption that your signal is sparse, though, it’s a good idea to sample at the Nyquist rate.
Fourier series
You probably first encountered Fourier series as part of your calculus course and later on as part of a partial differential equations course. Say we have some periodic function \(g(x)\), then the Fourier series associated with this is $$ a_0 + \sum_1^\infty (a_n \cos 2 \pi n f x + b_n \sin 2 \pi n f x) $$ where the Fourier coefficients are determined by $$ a_0 = \frac{1}{T} \int_{-T/2}^{T/2} g(x) \,\mathrm{d}x $$
$$ a_n = \frac{1}{T} \int_{-T/2}^{T/2} g(x) \cos 2 \pi n f x \,\mathrm{d}x $$
$$ b_n = \frac{1}{T} \int_{-T/2}^{T/2} g(x) \sin 2 \pi n f x \,\mathrm{d}x $$
i.e., we’ve projected the function onto its basis set of sines and cosines.
Already, I’m sure you are starting to see the close connection with what we’ve discussed of the Fourier transform. Traditionally, Fourier series are used as a jumping off point for the discussion of the Fourier transform.
In the last lecture, however, we signaled our intention to take the opposite approach, whereby we skipped over Fourier series and started with the idea that Fourier transforms exist because we observe physical systems which exhibit their behavior. Now, let’s unify the discussion and demonstrate the Fourier series as an extreme situation of the Fourier transform.
Fourier transform of sine and cosine
Let’s put together a number of the theorems that we’ve discussed to build up our understanding of what a Fourier series looks like in the Fourier domain.
In the previous lecture we introduced the Fourier transform theorem for a delta function located at the origin
$$ F(s) = \int_{-\infty}^{\infty} \delta(0) \exp (-i 2 \pi x s)\,\mathrm{d}x = 1 $$ which is a constant.
We also introduced the shift theorem, which says $$ f(x - a) \leftrightharpoons \exp(- 2 \pi i a s) F(s). $$
We can couple these together and write a relationship $$ \delta(x - a) \leftrightharpoons \exp(-2 \pi i a s). $$
Now, let’s see if we can use this Fourier pair to derive the Fourier pairs for cosine and sine. In your quantum physics or partial differential equations classes, you probably used the Euler identity to write cosine and sine like $$ \cos 2 \pi a s = \frac{e^{i 2 \pi a s} + e^{-i 2 \pi a s}}{2} $$ and $$ \sin 2 \pi a s = \frac{e^{i 2 \pi a s} - e^{-i 2 \pi a s}}{2i} $$
So we can do a bit of rearranging and arrive at
$$ \cos \pi x \leftrightharpoons \mathrm{even}(x) = \frac{1}{2}\delta \left (x + \frac{1}{2} \right) + \frac{1}{2}\delta \left (x - \frac{1}{2} \right) $$ and $$ \sin \pi x \leftrightharpoons i\mathrm{odd}(x) = i \frac{1}{2}\delta \left (x + \frac{1}{2}\right) - i \frac{1}{2}\delta \left (x - \frac{1}{2}\right). $$
where these symbols are the even and odd impulse pairs.
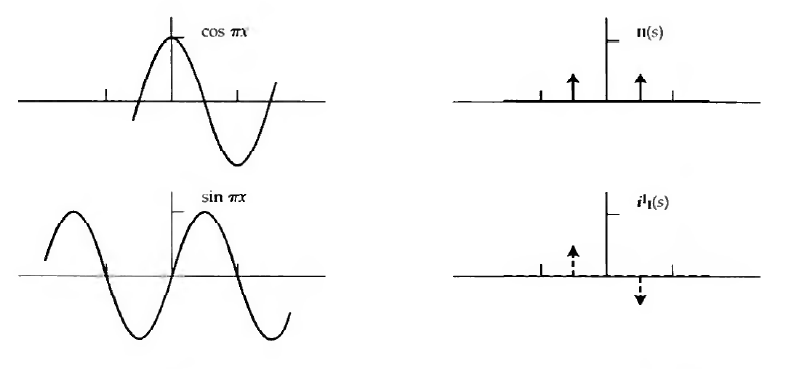
The Fourier transform pairs of cosine and sine as the even and odd impulse pairs, respectively. Credit: Bracewell Fig 6.1
Now we’re well on our way to determining the Fourier spectrum of a Fourier series. The Fourier series is just a sum of sines and cosines at different frequencies. The Fourier transform is a linear operator, so we can just add together the contributions from each component in the Fourier domain $$ a_0 + \sum_1^\infty (a_n \cos 2 \pi n f x + b_n \sin 2 \pi n f x) $$
We arrive at the result that the spectrum of a Fourier series is a collection of delta functions whose locations and amplitudes correspond to the frequencies and values of the Fourier coefficients, respectively.

The amplitude of the line spectra corresponding to a Fourier series. Credit: TutorialsPoint
Now that we’ve derived the Fourier spectrum of a Fourier series, we can see at least two reasons why this represents an extreme situation of the Fourier transform:
- The input waveform is strictly periodic
- The input waveform is infinite in duration
As we talked about in the last lecture, these conditions are violated in the real world. If we limit the duration of the sine wave to a finite duration (say, by multiplication of a truncated Gaussian (because technically the Gaussian is also non-zero over an infinite domain), which we call a window function), then we see what happens in the Fourier domain: the delta functions are broadened by convolution with the Fourier transform of the window function.
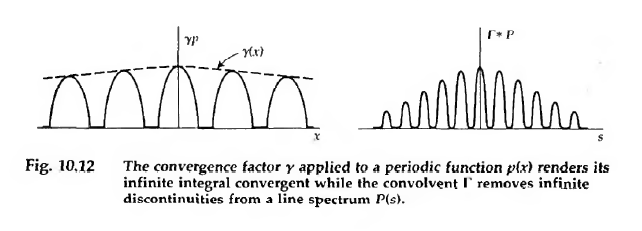
Left: the dotted line represents a broad window function to eventually make the waveform finite in duration. Right: this has the effect of broadening the delta functions by convolution with the Fourier transform of the window function. Credit: Bracewell Fig 10.12